Chart Tutorial Wizard
This topic is for new Logi developers. It guides you through the process of building a Logi report that presents data from your SQL database in a chart. It uses Studio's wizards to create the report.
This topic contains the following sections:
Requirements
Requirements
This tutorial assumes that you have:
- Microsoft IIS web server and .NET Framework 4.x installed, - OR -
-
A supported Java web server and Oracle JDK or OpenJDK 8, 11, 12, 13, or 14 installed;
 Oracle has changed its Java usage policies - see
Java Usage Policy
for important information.
Oracle has changed its Java usage policies - see
Java Usage Policy
for important information.
-
An un-expired trial license or a regular or OEM license file
installed in
C:\Program Files\LogiXML IES Dev\LogiStudio; - A working connection to a SQL database server;
- Credentials for accessing a table on the database server.
Tutorial
This tutorial builds on the Hello World! and
Data Table - Wizard tutorials. Please complete those tutorials
before proceeding with this one.
We also offer a more comprehensive tutorial,
Data Table Tutorial - Manual, which does not use Studio Wizards and provides more
"behind-the-scenes" insight into report creation.
Begin by launching Logi Studio, using its desktop icon or Start
 All ProgramsLogi InfoStudio.
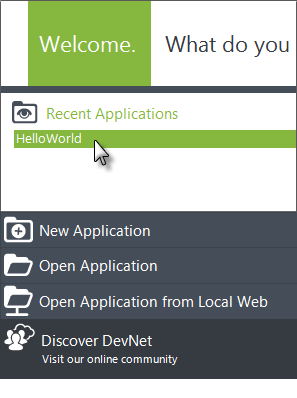
- In Logi Studio, close the Getting Started dialog box and re-open the HelloWorld application from the Welcome Panel, as shown above.
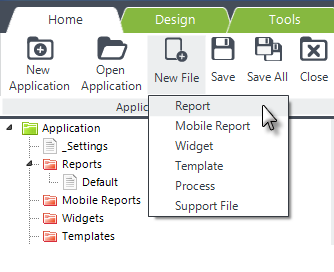
- Click the New File menu item, and select Report from its drop-down list of options, as shown above.
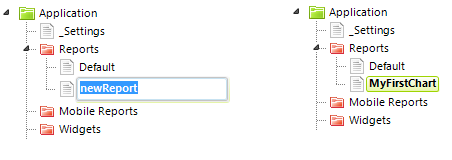
Studio will add a new report definition, named "newReport" in the Application Panel, and put it into rename mode. Just start typing a new name - such as "MyFirstChart" - and press Enter to rename it.
If something happens, like you click elsewhere, and it exits rename mode, just select the newReport definition and press F2, or right-click and select Rename, to rename it.
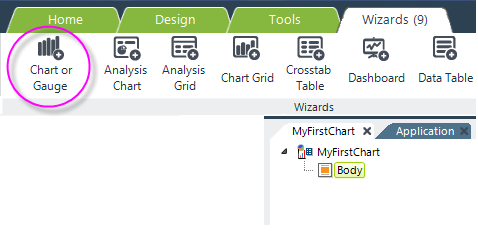
- You probably noticed that the new definition was opened in the Workspace editor. Select its Body element and the Wizards tab will appear in the main menu. In the Wizards tab, click the Chart or Gauge menu item to start the Add a Chart or Gauge wizard.
-
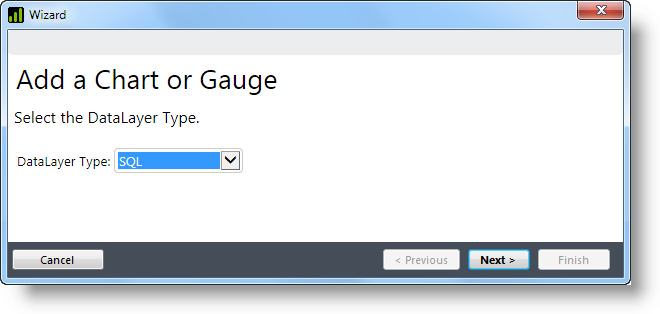
The wizard will first ask you to specify the datalayer type. Datalayers
retrieve data for use in reports. Use the default SQL datalayer
type and click Next.
-
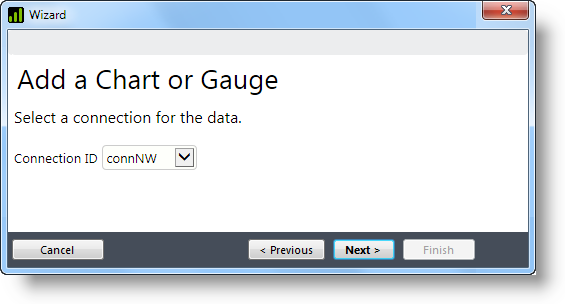
Data for this report is coming from a database server, so you need to
establish a connection to it. Select the connection you created
in the previous tutorial (or create a new one) and click
Next.
-
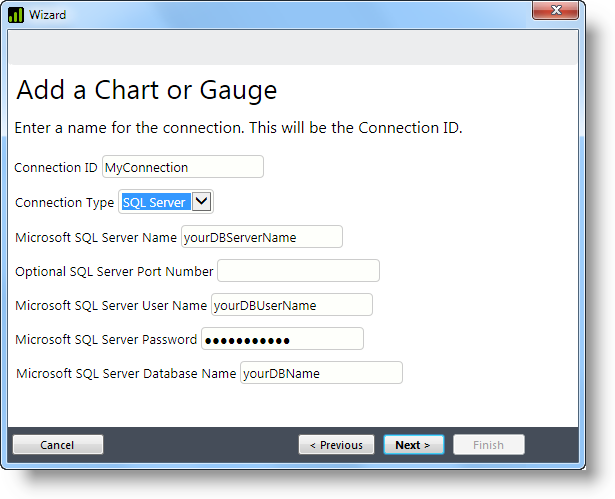
If you chose to create a new connection, the wizard will prompt you, in
separate dialog boxes, for all of the information shown above. To save
space, we've grouped them into one wizard image. You'll provide
information as necessary and click Next to proceed each time.
The prompts shown above are for Microsoft SQL Server, but they'll vary depending on the Connection Type you select.
After you provide the requested information, the wizard will test the connection and present its status. If there's a problem, you can click Previous to go back and review or change your entries. Click Next again as needed to re-test the connection.
-
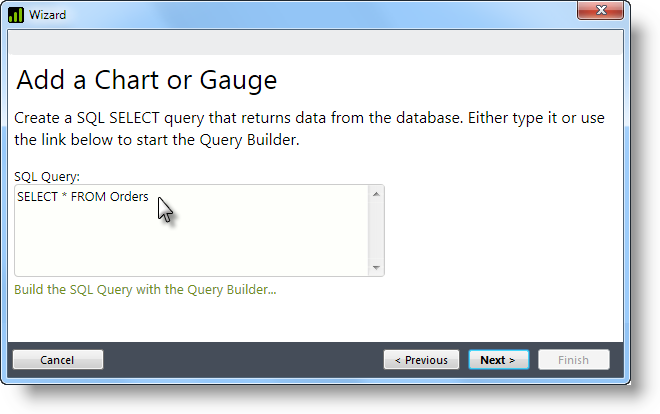
Once the connection is successful, you're ready to enter a SQL query.
Skip using the SQL Query Builder this time and just type-in a simple
query, like the one shown above, that will return some columns from your
database. The click Next to continue.
-
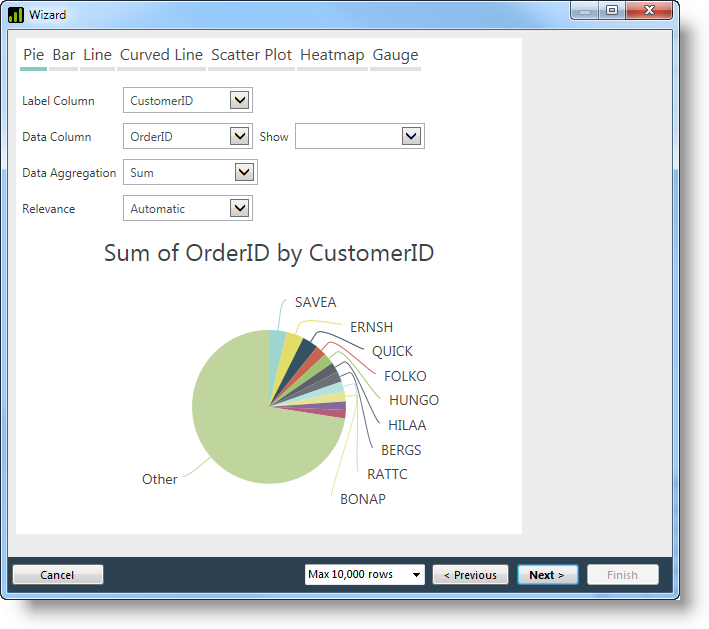
As shown above, the next dialog box displays a chart preview. Different
chart type options are listed across the top of the box and will vary
depending on your data. Click them to try out some different charts! You
can also change the data columns that are used in the chart and other
supporting configuration options. Once you have the preview chart the
way you want it, click Next to continue.
-
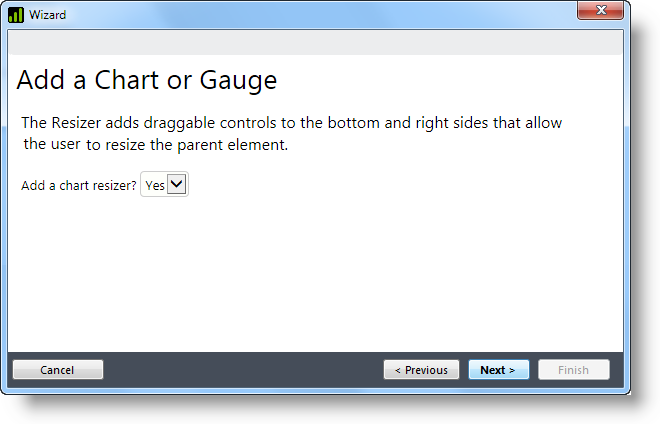
The wizard will prompt you to add Resizer controls to the chart. These
allow the user to resize the chart at runtime by dragging "resizer
handles". Click Next to continue.
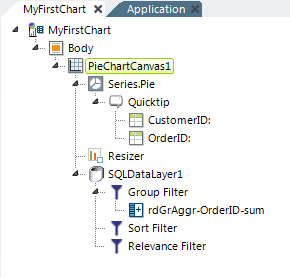
- The wizard will insert all of the properly configured elements necessary for the chart you created into your definition, as shown above, and then exit.
-
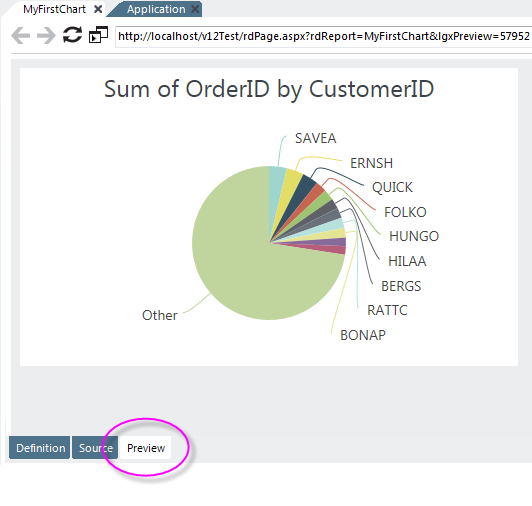
Click the Preview tab at the bottom of the Workspace editor to
save your work and preview the report in Studio. You should see
something like the example shown above.
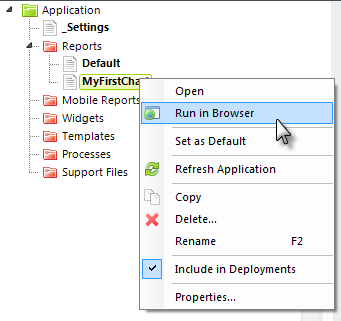
If you'd like to view it in your default browser, select and right-click the report definition, as shown above, and select Run in Browser from its context menu.
Well done! We recommend that you take some time to examine the elements the wizard added to your report and _Settings definitions. Congratulations on completing this tutorial.