Series.Waterfall
The Chart Canvas element's Series child elements cause a data visualization (the chart) to be rendered in the canvas.
The following topics discuss the Series.Waterfall child element:
- Using Multiple Series
- Series.Waterfall Attributes
- Using the Data Labels Element
- Using the Quicktips Element
- Using Action Elements
- Using Input Selection
- Using the Refresh Series Timer
About Series.Waterfall
The Series.Waterfall element generates a Waterfall chart, which helps in understanding the cumulative effect of sequentially introduced positive or negative values.

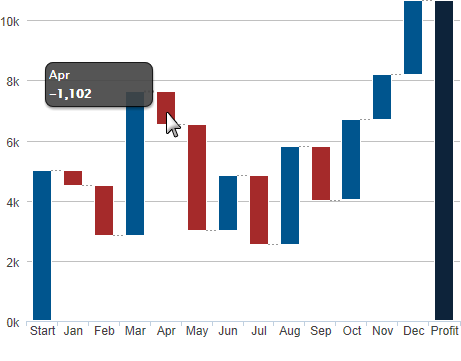
The example above shows a Waterfall chart, with negative values shown in red. A special "total bar", labeled Profit above, is automatically generated from the sum of all other values. It appears as the last bar on the right or, at the top, if the axes are swapped. Its generation can be controlled in the Series attributes.

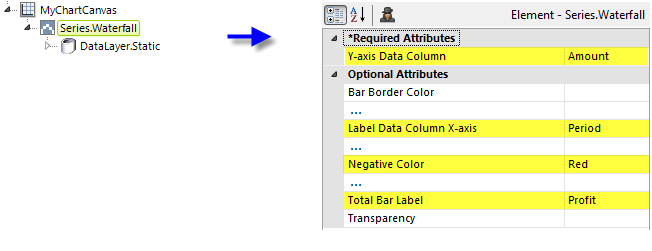
As shown above, the chart is created by adding Series.Waterfall to the canvas, along with a datalayer. Very few attributes need to be set for the Series element in order to produce a basic chart.
![]() A datalayer element can be used either beneath Series.Waterfall, as shown above, or beneath Chart Canvas. If used as a child of Chart Canvas, its data is available to all child Series elements. This can improve performance if you have several series, all using the same data, beneath the same Chart Canvas element.
A datalayer element can be used either beneath Series.Waterfall, as shown above, or beneath Chart Canvas. If used as a child of Chart Canvas, its data is available to all child Series elements. This can improve performance if you have several series, all using the same data, beneath the same Chart Canvas element.