Analysis Grid Developers - Retrieving and Using Data
The Analysis Grid works with any standard datalayer to retrieve data, which is then cached in session. This allows changes the user makes using the AG's user interface to change the displayed data very rapidly.
Resetting Cached Data
If, after initially retrieving and viewing data in the AG, you then change the data retrieved (for instance, by changing your SQL query) and you do not end your session by completely closing and re-opening your browser, you will see no data differences, due to the session-based caching.
To reset the UI selections or the data without ending the session, you need to refresh the page and pass the special query string parameters, rdAgReset and/or rdAgRefreshData with a True value. These are discussed in Analysis Grid Developers - Special Query String Parameters, and here's an example of one of them in use:
yourLogiApp/rdPage.aspx?rdReport=yourAGReport&rdAgReset=True
This can be achieved in several ways, including using Action.Report with Link Parameters.
In many use-cases, this cached data approach provides adequate performance. However, if you're working with very large data sets, you may be able to take advantage of the following two special data retrieval elements.
Crosstabs and Calculated Columns
If you're working with standard dalayers, you can use The Calculated Column elements beneath them to add columns to the datalayer. These columns will then be available to the end-user in the Analysis Grid.
![]() To prevent creation of unmanageable tables, numeric columns (calculated or otherwise) are not available for use in a Crosstab Table as the Header Values Column, Label Values Column, or the Secondary Label Column.
To prevent creation of unmanageable tables, numeric columns (calculated or otherwise) are not available for use in a Crosstab Table as the Header Values Column, Label Values Column, or the Secondary Label Column.
DataLayer.ActiveSQL
This special-purpose datalayer, DataLayer.ActiveSQL, can provide better performance for large data sets. Follow the link and read its documentation for important database restrictions.
The datalayer provides the basic SQL query needed to retrieve data but doesn't initially retrieve and cache
all of the result set, like a standard datalayer does. Instead, in response to runtime manipulations of the Analysis Grid interface, it dynamically modifies its own SQL query and retrieves the minimum required amount of data with each request. This increases the number and frequency of SQL queries the database server must handle (and, generally, isn't a burden on it) but improves performance for the user.
Active Query Builder
Typically, when the Analysis Grid is configured with a SQL datalayer, it retrieves data based on a SQL query hard-coded by the developer. The query determines the dataset that will be available to users for analysis.
The Active Query Builder element, available with the Self-Service Reporting Module, extends our ActiveSQL technology and is subject to the same database restrictions as DataLayer.ActiveSQL, see Add-on Modules. It provides a different approach for Analysis Grid queries: when used instead of a datalayer, it allows users to have more choice about what data to work with, by giving them a way to interactively select tables, views,
columns, and joins, at runtime.

When added as a child of an Analysis Grid, the Active Query Builder element causes a special "Data" tab or button to appear in the Analysis Grid, as shown above. In it, users can select the tables, views, columns, and joins they want to
work with. Like DataLayer.ActiveSQL, the Active Query Builder creates SQL queries on-the-fly based on Analysis Grid UI manipulations.
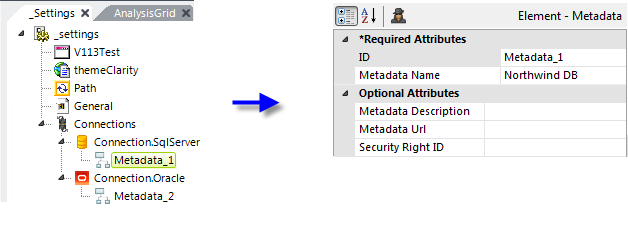
The developer, however, still ultimately controls which tables, views, columns, and joins are available in this tab. This is done by building a "metadata file", associated with a Connection element, which enumerates all of the database objects that will be available to users for selection in the Analysis Grid.
The Active Query Builder element's attributes are:
| Attribute | Description |
|---|---|
ActiveSql Buffer Size | Specifies the maximum number of rows to buffer when reading from the data source. The buffer is used when paging tables so that the data source need not be queried for every new page of rows. The default value is 5,000 rows. The default value is 200 rows. |
Hide Column Selection | Specifies which Active Query Builder user interface to display. When set to True, a simplified interface is shown that allows users to select tables, but not columns (all columns are automatically selected). The default value, False, allows table and column selection. |
Metadata IDs | Specifies the IDs of one or more Metadata elements that have been defined beneath Connection elements. Multiple IDs can be entered in a comma-separated list and, when more than one Metadata ID is specified, the interface offers users a choice of data sources. |
Template Modifier File | Specifies the name, with file extension, of Template Modifier Files to be applied to the Active Query Builder at runtime. This is an XML file that can be used to change the underlying template used to create the Active Query Builder. Template Modifier files can be in any folder accessible to the application; if a folder isn't specified, the _SupportFiles folder is assumed. |
The Metadata element provides a tool, the Metadata Builder Wizard. This tool is used during development to create the metadata file. ![]() The Metadata Builder Wizard has been deprecated and replaced with a browser-based tool, the Web Metadata Builder, which is described in Web Metadata Builder.
The Metadata Builder Wizard has been deprecated and replaced with a browser-based tool, the Web Metadata Builder, which is described in Web Metadata Builder.
Multiple metadata files can be associated with a single Connection element. You can add Metadata elements and build the files by selecting the Connection element and running the wizard. Or, metadata can be retrieved instead from a REST-style web service by specifying the service's URL in the Metadata element's Metadata Url attribute. When the MetaData Url is specified, the Web MetaData Builder works in read-only mode, allowing the user to view everything, but editing permissions are withheld.
Unless otherwise configured, the Active Query Builder will automatically include the metadata from all existing Metadata elements in the Data tab. If this is not desired, its Metadata IDs attribute can be used to list specific Metadata elements (and their files) to be used.
Analysis Grid Column elements are not used with the Active Query Builder. You'll see an error if you include these elements.
The Data tab panel normally includes check boxes so that users can individually select columns for analysis. However, these can be hidden by setting the Active Query Builder element's Hide Column Selection attribute to True, in which case all columns will be available for use.
Aggregations
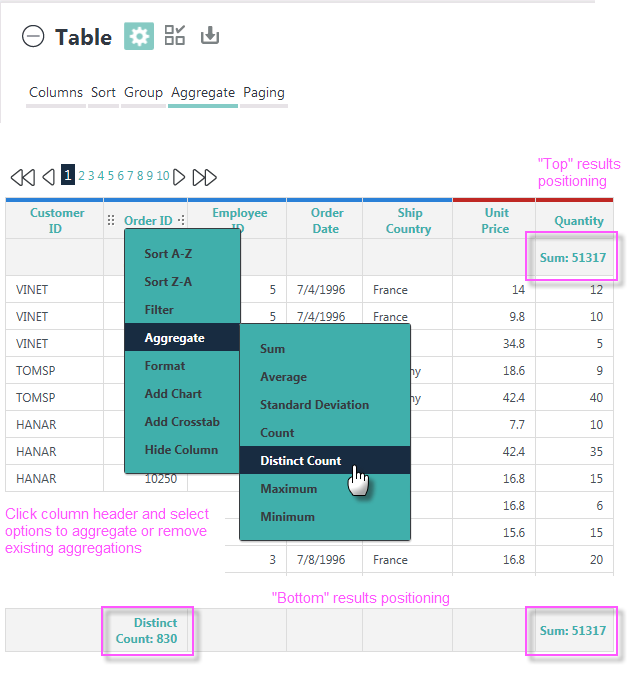
Users can create aggregations of column values and display them in summary rows, using either the Aggregate option at the top of the Table configuration area, or by clicking a table column header and selecting Aggregate:

When creating aggregations, columns with Null values are excluded by default. If you want them to be included, create the constant rdCalculationsIncludeNulls and set it to True.
The format of aggregated values will match that of their table column.
Aggregated values, by default, are displayed with a label that's the name of the aggregating function. In the example above, they're "Sum:" and "Distinct Count:". These labels can be hidden by setting the Analysis Grid element's Hide Function Names Default attribute to True.
