Creating a Text Cloud
Text clouds are easy to create; the data required consists of the words or phrases and a numerical weighting or frequency value. The following example application will show developers how to use the appropriate Logi Info elements to create a text cloud.
- In Logi Info Studio, create a new application or a new report definition in an existing application.
- Log in to DevNet.
- Download the sample data for this exercise. If it opens in your browser, right-click it and select "View Source" or a similar source-related option. Then save it to your application's _SupportFiles folder as DevNetSearches.xml. These are the search terms and their frequencies from the DevNet site search log for a few weeks, in an XML file.
<ItemTerms="Connection.ODBC"
Frequency="12"
/>
<ItemTerms="InputDate"
Frequency="14"
/>
<ItemTerms="Show Modes"
Frequency="23"
/>
<ItemTerms="Body"
Frequency="27"
/>
<ItemTerms="Report"
Frequency="92"
/>
<ItemTerms="Procedure.Script"
Frequency="11"
/>
<ItemTerms="Chart.Pie"
Frequency="38"
/>
The fragment above shows some of the data that's in the sample file. Notice that it contains two data attributes "Terms" and "Frequency". These are the data "columns" you'll be referring to later.
/* TextCloudStyles.css */BODY {
BACKGROUND: #ffffff;
font-family: veradana, arial;
}A:link {
text-decoration: none;
}A:hover {
text-decoration: underline;
}.fontBlue {
color: blue;
}.fontGreen {
color: green;
}.fontOrange {
color: orange;
}
- In Studio, under the _SupportFiles folder, add a new style sheet to your application and give it a name of your choice. Copy the class definitions shown above into it, save it, and assign the style sheet to your report definition's Style element.


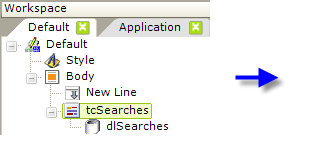
- From within the Charts, Gauges and GIS Maps folder in the Element Toolboxpanel, add a Text Cloud element beneath the Body element of your report, as shown above.
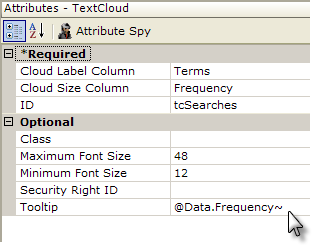
- Set the Text Cloud element's Cloud Label Column attribute value to the name of the data column containing the actual words or phrases to be displayed. In the case of the sample XML data, this column is "Terms".
- Set its Cloud Size Column attribute value to the name of the data column containing the numeric weighting of each word or phrase. In the case of the sample XML data, this column is "Frequency".
- Assign a unique ID to the Text Cloud element (entering a value here is required).
- Set the Text Cloud's Max and MinFont Size attributes. These sizes, in pixels, will be assigned to the words or phrases with the largest and smallest weighting values. Words with values in between the maximum and minimum will be given font sizes proportionate to their weighting value.
- Set the Tooltip attribute to the value of the Frequency data column. This will cause the actual weighting value to be displayed when the mouse hovers over any word or phrase.
- Beneath the Text Cloud element, add a DataLayer.XML File element. Set its ID attribute to some unique value and set its XML File attribute to the name of the XML file you downloaded back in Step #2: DevNetSearches.xml.

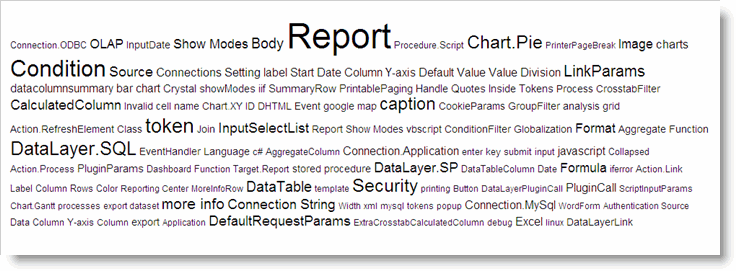
Save and preview your report and you should see the text cloud shown above. When you hover your mouse over the words, their actual frequency in the search log should appear as a tool tip. Notice how the size of the words is related to their frequency.
We used an XML file as the data source for this example, but any type of datalayer element can be used to retrieve the data.
Formatting Data Using Calculated Column
As with other Logi chart elements, a Calculated Column element can be used to manipulate actual data and create a pseudo-column in the datalayer that is then used in the text cloud. For example, if your data had separate first and lastname columns but you wanted to display them as a single, combined name in the text cloud, you'd add a Calculated Column element beneath your Text Cloud, set its Formula attribute to combine the two name columns (@Data.FirstName~ @Data.LastName~) and then use the Calculated Column element's ID as the value for your Text Cloud element's Cloud Label Column attribute.