Interactive Chart Configurations
All of the charting elements' attributes can be "tokenized"; that is, you can use tokens in them as values. This allows charts to be highly-interactive and dynamically customizable.
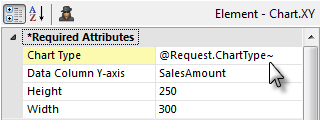
For example, a report page could include an Input Select List element so the user has a choice of chart types: Bar, Line, and Area. When the user makes a selection, the report will be refreshed and their selection is automatically passed as a Request variable. The resulting @Request token can then be used in the a Chart.XY element's Chart Type attribute, as shown above, to dynamically set the chart type. Other use-case examples include:
- Through the use of cookies and @Cookie tokens, chart configurations can be "personalized" for individual users and the settings retained between sessions.
- Charts can be included in reports as child elements of tables and have a "data-driven" configuration, using @Data tokens to provide values for chart attributes.
The chart configuration flexibility available through the use of tokens is quite extensive, providing opportunities for user-customizable chart size, colors, type, content, and more.
Hover Highlight
The Hover Highlight child element causes chart features, such as bars and lines, to be highlighted
when the mouse pointer is hovered over them, making it easier for users to visualize the
item under the pointer. The element is available for use with Static Pie, Bar, Line, Area, and Scatter charts.

The element's attributes enable customization of the highlight overlays. The Fill Color attribute applies to Pie and Bar charts, the Border Color and Border Width attributes to Line, Area, and Scatter charts, and Line Color applies to Line and Area charts.
![]() Attempts to use the ThemeAlignCenter class, or other CSS classes that use text-align, on a container such as a DIV in order to center a chart that includes Hover Highlight are likely to fail. Hover Highlight is not a simple HTML entity, like text or an image, that other content can flow around; it's wrapped in
its own
DIV
and no longer behaves like block content. One possible alternate approach is to use an HTML table instead of a DIV as the container. Due to its non-standard behavior, this kind of centering will work with IE 9 only.
Attempts to use the ThemeAlignCenter class, or other CSS classes that use text-align, on a container such as a DIV in order to center a chart that includes Hover Highlight are likely to fail. Hover Highlight is not a simple HTML entity, like text or an image, that other content can flow around; it's wrapped in
its own
DIV
and no longer behaves like block content. One possible alternate approach is to use an HTML table instead of a DIV as the container. Due to its non-standard behavior, this kind of centering will work with IE 9 only.
Zoom Chart
The Zoom Chart element provides users with the ability to "zoom" into a chart's data by selecting an area on the chart. The Zoom Chart is available for use with static Chart.XY and Chart.Scatter elements.
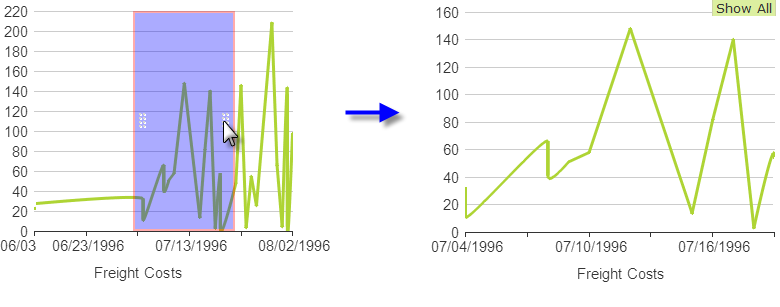
There are two configurations of the Zoom Chart. In the first, shown above left, the "selection area" appears right over the parent chart. Resizing handles allow its size to be adjusted and it can also be dragged horizontally. When the mouse button is released, the parent chart zooms in or out to include just the data within the selection area, as shown above right. Successive selections can be made on the zoomed chart. The "Show All" button returns the view to encompass all of the
original data.
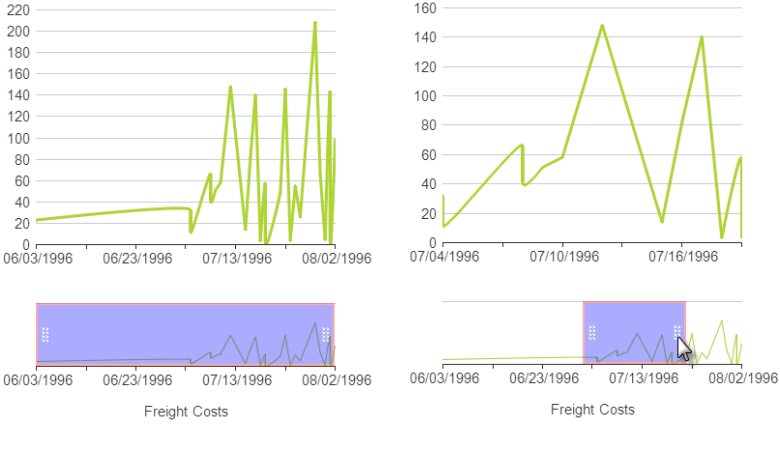
In the second configuration of the Zoom Chart, shown above, a smaller version of the chart, with selection area, appears below the chart. Changes to the selection area cause the view of the data in the chart to change correspondingly.

As shown above, the Zoom Chart element is added as a child of the parent chart and its attributes allow you to customize the selection area and chart. The Location attribute is set to None to display the selection area on top of the chart; setting it to Bottom displays the small selection area and chart beneath it.

A Label Scale element is also required, as shown above, with a Scaling Mode set to one of the Linear options (based on your X-axis data type).
InputChart.List and InputChart.Range
The InputChart.List and InputChart.Range elements allow users to work with charts as user input elements. Users can select data values on a chart and pass them, in manner similar to other user input elements, through Request tokens to other definitions. To use either one of them, add it as the parent element of a Static chart element.
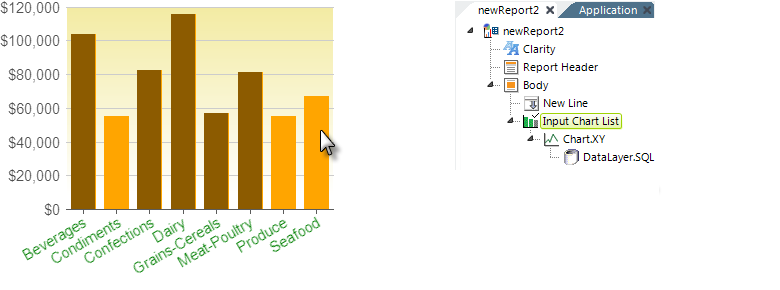
As shown above, InputChart.List works with Static Bar and Pie charts. At runtime, chart bars or wedges can be clicked to select them. When the report page is submitted, the X-axis values are submitted to the next definition as a Request token that includes the chart ID, whose value is comma-separated list. For example,
@Request.ChartXY_Bar~ = "Condiments,Produce,Seafood"
would result from submitting the example above. The element includes attributes common to Input elements and attributes for specifying the colors of selected and unselected bars or wedges. Standard Action elements (not shown) are required to submit the page.
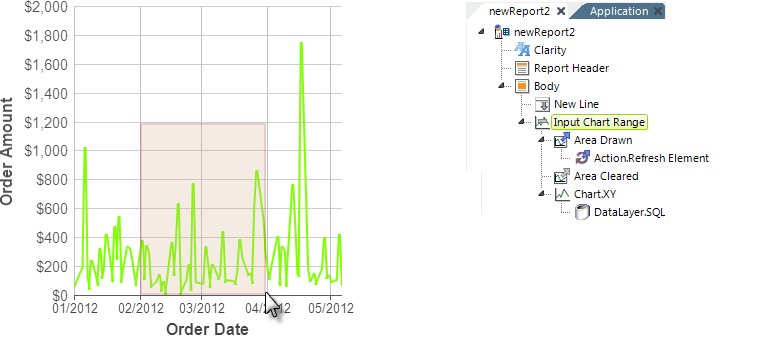
As shown above, InputChart.Range works with Static Line, Spline, and Scatter charts. At runtime, a "selection area" can be "drawn" onto the chart plotting area to select values by dragging the mouse. When the report page is submitted, the maximum and minimum X-axis and Y-axis values are submitted to the next definition as individual Request tokens. For example:
@Request.minX_value~ = "2/20/2012"
@Request.maxX_value~ = "3/31/2012"
@Request.minY_value~ = "0"
@Request.maxY_value~ = "1200"
would result from submitting the example above. Clicking outside of the selection area will clear it.
The element includes attributes for specifying the names of the request variables to be associated with the value range and the colors of the selection area. Two special child event handler elements, Area Drawn and Area Cleared, can be used to fire standard Action elements, as shown, when the selection area is drawn or cleared, refreshing or submitting the page. In addition, or instead, standard, unrelated Action elements (not shown) can also be used to submit the page.
More information is available in Working with User Input Elements.