Chart Types and Styles
The following images illustrate the chart types and styles available in the Chart.Polar element. All of the examples, except the last two, have been plotted with the same polar-style and a single dataset:
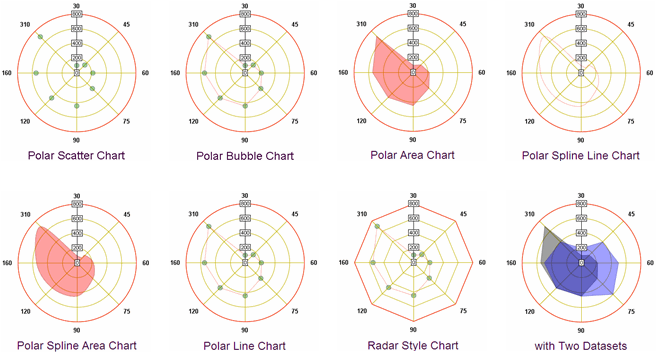
The last two examples show a "radar-style" chart and a polar-style area chart with two overlapping datasets (or layers). As you can see, Logi Studio provides a useful variety of styles with this new element. As with all Logi charting elements, special child elements are available to control the formatting of the borders, lines, areas, data labels, legends, and titles in polar charts.