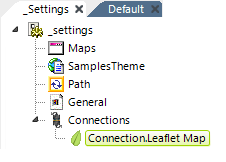
| Connection.Leaflet Map - This special type of Connection element is required for communicating with the map server. Like all Connection elements, it resides in your _Settings definition. See Leaflet Maps - Connecting to Map Servers for detailed information about configuring this element. |
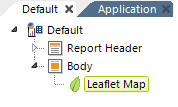
| Leaflet Map - The root element for implementing a Leaflet Map in your report. Attributes include: - Height & Width - Specifies optional dimensions, in pixels, for the map.
- Hide Layer Control - Specifies whether the map Layer selection control is visible on the map or not. The control will appear when there are two or more map layers configured.
- Hide Scale - Specifies whether the Scale legend is visible on the map or not.
- Hide Zoom Control - Specifies whether the Zoom control is visible on the map or not.
- ID - Specifies a unique ID for this element.
- Security Right ID - When Logi Security is enabled, specifies
the Security Right IDs of users who will be able to see this element. Multiple Right IDs, separated by
commas may be entered.
|
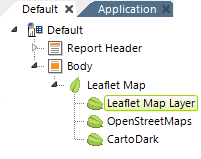 | Leaflet Map Layer - Required child element that specifies the Connection in the _Settings definition to use to display this layer of map tiles. Multiple Leaflet Map Layer elements may be used and, if so, the Layer Control on the map allows users to switch layers at runtime. This allows you to offer different map types, such as Streets,Terrain, Satellite, etc, from the same map server. Attributes include: - Connection ID - (Required) Specifies the ID of a Connection.Leaflet Map element in the _Settings definition.
- ID - Specifies a unique ID for this element.
- Map Layer Control Caption - Specifies the identifying text that will appear in the Layer Control for this layer. If left blank, the Connection ID text will appear.
- Show Layer As Overlay - Specifies whether this layer will be available as an overlay on other layers, allowing layers to the "stacked". If set to True, this layer is displayed in the Layer Control with a check box instead of a radio button.
If multiple Leaflet Map Layer elements are used, the first one (top-most in the Element Tree) will be the default layer used when the map is first displayed. |
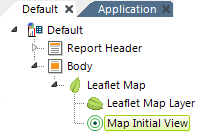 | Map Initial View - Optional child element that allows you to set the initial Zoom level and geographic location the map will open to when the page is first displayed. Attributes include: - Map Zoom Level - Specifies the resolution of the initial map. Values can range from 0 (the
lowest zoom level, in which the entire world appears on the map) to a number reflecting the highest possible zoom level (usually less than 20, varies by map server).
- Latitude & Longitude - Specifies the positioning values, in the data returned in the associated datalayer, for each marker. If left blank, the defaults are "@Data.Latitude~" and "@Data.Longitude~". Like all tokens, the column names are case-sensitive.
|
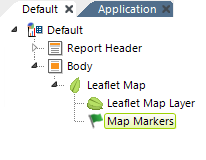
| Map Markers - Optional child element that causes Map Markers to appear on the map to pinpoint a location, based on latitude and longitude positioning values. The graphic image for the marker can consist of an image or gauge; a default image is provided. A child datalayer is used to retrieve the geographical data. Attributes include: - ID - (Required) Specifies a unique ID for this element.
- Latitude & Longitude - Specifies the positioning values, in the data returned in the associated datalayer, for each marker. If left blank, the defaults are "@Data.Latitude~" and "@Data.Longitude~". Like all tokens, the column names are case-sensitive.
- Security Right ID - When Logi Security is enabled, specifies the Security Right IDs of users who will be able to see this element. Multiple Right IDs, separated by commas may be entered..
You can add Action elements below this element so that when a user clicks a marker, an information panel appears or another report is shown.
|
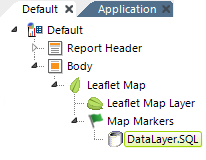 | DataLayer - A datalayer element is used to retrieve the data you wish to visualize on the map. As usual, the datalayer can have calculations, aggregations, grouping, etc. to shape the data. Any type of datalayer element can be used.
The schema for data for this purpose should include at least some combination of the following columns (see Leaflet Maps - About Mapping Data): - Place Name
- House Number
- Street address
- City
- State
- Country
- Postal Code
|
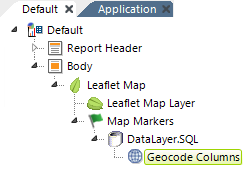 | Geocode Columns - This optional element can be used if your data does not already include geographic coordinates. It accepts address data and, via the Google Map web service, attempts to retrieve latitude and longitude values ("geocoding") for each record in the datalayer. The values are placed into two columns, named "Longitude" and "Latitude", whichare added to the datalayer data.  Geocode Columns can also be used in DataLayers for Google Map Polygons and Google Map Polylines to automatically obtain polygon data when used with a Nominatim connection element. For connections to a free, public, OpenStreetMap (OSM) Nominatim server for geographic data. More information is available in Datasource Connections. Geocode Columns can also be used in DataLayers for Google Map Polygons and Google Map Polylines to automatically obtain polygon data when used with a Nominatim connection element. For connections to a free, public, OpenStreetMap (OSM) Nominatim server for geographic data. More information is available in Datasource Connections.  You must secure a Google Maps API license to use this element or use an alternate geographic data source. You must secure a Google Maps API license to use this element or use an alternate geographic data source.
Follow this link for a list of the countries for which Google currently provides geocoding. Other web service brokers also provide geocoding in other countries. Element Attributes include: - City Data Column - Name of a datalayer column that has the city name.
- Connection ID - The ID of the Connection.Google Maps element you added to your _Settings definition. If blank, the first (top-most) element of this type in _Settings will be used by default.
- Country Data Column - Name of a datalayer column that has the country name.
- ID - A unique ID for this element.
- Include Condition - An expression that evaluates to a value of True or False. If the attribute is blank or evaluates to True, geocoding will occur; if the value evaluates to False, the element is skipped.
- House Number Data Column - The name of a datalayer column that contains the street number.
- Latitude Column ID & Longitude Column ID - The names of the columns that the web service will add to the datalayer and fill-in with the Latitude and Longitude values. Default column names are "Latitude" and "Longitude".
- Place Data Column - The name of a datalayer column that has the entire address information or a place name in a single string. Use this attribute when the address data is not broken up into separate columns or when naming a point-of-interest, such as "Washington Monument" or "Grand Canyon". Use of this attribute disables the other location data columns.
- Postal Code Data Column - The name of a datalayer column that has the postal code data (the "Zip Code" in the U.S.)
- State Province Data Column - The name of a datalayer column that has the state or province name.
- Street Data Column - Name of a datalayer column that contains the street name.
|
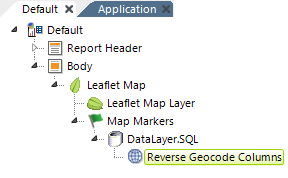 | Reverse Geocode Columns - This optional element can be used to produce address data from geographic coordinates. Using the Google Maps web service, values returned are put into columns that are added to the datalayer, using these column names:
"StreetNumber", "StreetName", "Locality", "Sublocality", "AreaLevel1",
"AreaLevel2", "AreaLevel3", "Country", "Latitude", "Longitude", and"PostalCode".
You must secure a Google Maps API license key to use this element or use an alternate geographic data source.  Logi Info now includes the Connection.Nominatim element, for connections to a free, public, OpenStreetMap (OSM) Nominatim server for geographic data. More information is available in Datasource Connections. Logi Info now includes the Connection.Nominatim element, for connections to a free, public, OpenStreetMap (OSM) Nominatim server for geographic data. More information is available in Datasource Connections.
Attributes include: - ID - (Required) Specifies a unique ID for this element.
- Latitude Data Column - (Required) Specifies the name of the existing datalayer column that contains the latitude values.
- Longitude Data Column - (Required) Specifies the name of the existing datalayer column that contains the longitude values.
|
 | Map Marker Image - This optional Map Markers child element is a container for an Image that provides the image for the Map Marker element. If this element is not included in the definition, the default marker image is used. The default image is: Data can be used here in interesting ways. For example, an image caption (image file name) and the image size can be data from the datalayer (their values can be @Data tokens), so locations can be differentiated visually based on their data.  You cannot add a chart canvas element under the Map Marker Image; to do this, you must first add an Action.Map Marker Info and Map Marker Info element. You cannot add a chart canvas element under the Map Marker Image; to do this, you must first add an Action.Map Marker Info and Map Marker Info element.
|
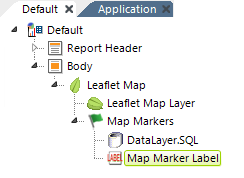 | Map Marker Label - This optional Map Markers child element allows you to define a label that will appear under the marker. The label can be styled most
easily using CSS. |
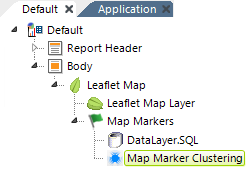 | Map Marker Clustering - When present, this optional Map Markers child element will group markers into clusters according to their
distance from a cluster's center. When a marker is added, the marker cluster
will find a position in all the clusters or, if it fails to find one, will
create a new cluster with the marker. The number of markers in a cluster will be
displayed on the cluster marker. Clusters will break apart into individual markers when the mapped is zoomed-in sufficiently. This element has no attributes. |
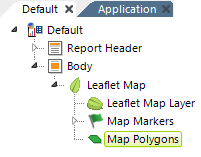 | Map Polygons - This optional child element plots overlaid regions onto the map. They can be semi-transparent and have
colors that are based on data values. Polygons are plotted from sets of latitude and longitude points.
These typically come from a DataLayer.Gpx File or DataLayer.Kml File element. Logi also supports the use of maps with WKT formatted polygons and multipolygons. - ID - (Required) Specifies a unique ID for this element.
- Border Color and Thickness - Specifies the polygon border color and thickness in pixels. Default color: Red
- Border Transparency - Specifies a level of transparency for the border, where 0 =
opaque and 15 =
completely transparent. Default: 4
- Fill Color - Specifies the color that fills the polygon interior. Tokens can be used here to set the color based on data. Default: Red
- Fill Transparency - Specifies a level of transparency for the interior, where 0 = opaque and 15 = completely transparent. Default: 4
You can add Action elements below this element so that when a user clicks a polygon, an information panel appears or another report is displayed. You can also add a Polygon Color Spectrum Legend element beneath this element. The legend shows a bar displaying a spectrum of colors associated with the polygons and representing the gradation between low and high values in the data. The legend may be displayed to the right or below its parent map. |
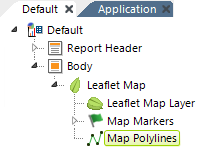
| Map Polylines - Map Polylines are lines plotted onto a map and are optional. They can be semi-transparent and have colors that are based on data values. Polylines are plotted from sets of latitude and longitude points. These typically come from a DataLayer.Gpx File or DataLayer.Kml File element. Logi also supports the use of maps with WKT formatted polylines and multipolylines. - ID - (Required) A unique ID for this element.
- Border Color and Thickness - Specifies the polygon border color and thickness in pixels. Default color: Red
- Border Transparency - Specifies a level of transparency for the border, where 0 = opaque and 15 = completely transparent. Default: 4
You can add Action elements below this element so that when a user clicks a polygon, an information panel appears or another report is shown. |
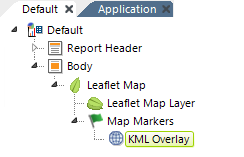 | KML Overlay - This optional element allows display of one or more KML files as overlays on the
map. When an overlay is used, the boundary viewport details (location and
zoom) are set according to the last KML file in the list. - ID - (Required) Specifies a unique ID for this element.
- KML URL - Specifies the URL of a KML or KMZ file. The URL must be publicly-accessible;
local intranet URLs will not work.
|
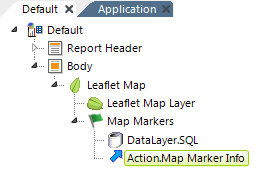
| Action.Map Marker Info - This optional element adds Click event processing to the Map Markers element. When a map marker is clicked, processing flow continues with this element's child elements. Attributes are: - ID - (Required) Specifies a unique ID for this element.
- Security Right ID - When Logi Security is enabled, specifies the Security Right IDs of users who will be able to click a map marker and initiate an action. Multiple Right IDs, separated by commas may be entered.
|
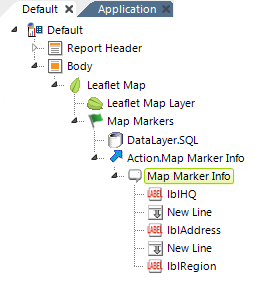
| Map Marker Info - This optional element creates the pop-up "balloon" that appears over the map when a map marker is clicked. A wide variety of elements can be placed as children below this element to display information, including images, links, data, and more. The data from the row associated with the clicked marker is available to the children of this element as @Data tokens. If you choose to use a SubReport element to display data the pop-up balloon, you must use its Embedded subreport mode. |
