Animated Map Element
Animated Maps are included in Logi Info applications by adding the Animated Map element to a report definition.

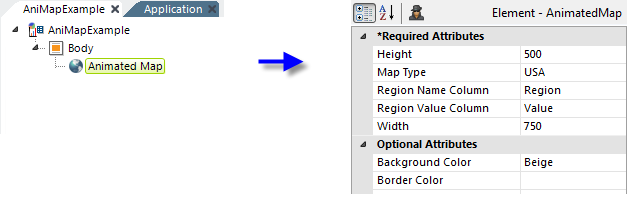
In the example above, an Animated Map element has been added and its attributes set as shown.

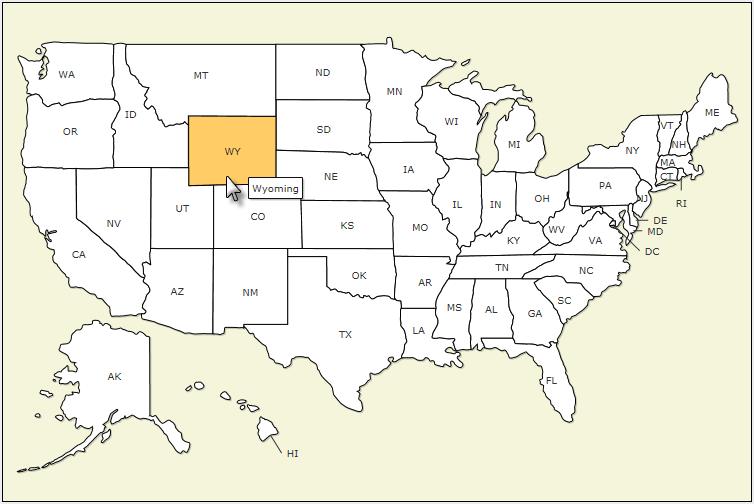
The resulting map is shown above. When the cursor passes over a state, its color changes and a "tooltip" appears with the full state name. The attributes for the Animated Map element are explained below. Unless otherwise noted, attribute values are optional.
| Attribute | Description |
|---|---|
| Height | (Required) Specifies the height of the map, in pixels. |
Map Type
|
(Required) Specifies the type of base map to be rendered; e.g. World, USA, China, USARegion etc. A complete list of base maps is provided at the end of this topic.
Specific map type values can be found by examining the .js files in the application folder's rdTemplate\rdFusionMap folder. The India map, for example, is called FusionCharts.HC.india.js and the country or state name portion "india" is the value that's entered in this attribute.
|
| Regional Name Column | (Required) Specifies the name of a column in the datalayer, with data representing the name/ID for each region inside a map. If a datalayer is not being used, enter an arbitrary placeholder value. |
| Regional Value Column | (Required) Specifies the name of a column in the datalayer, with data representing the value for each region to be mapped. If a datalayer is not being used, enter an arbitrary placeholder value. |
| Width | (Required) Specifies the width of the map, in pixels. |
| Background Color | Specifies the color of the map background; can be either a color name, a decimal RGB value, or a hex RGB value prefixed with a pound sign (#112233). "Transparent" is a valid value. |
| Border Color | Specifies the color of the map border lines, can be either a color name, a decimal RGB value, or a hex RGB value prefixed with a pound sign (#112233). "Transparent" is a valid value. |
| Color | Specifies the default color of the map; can be either a color name, a decimal RGB value, or a hex RGB value prefixed with a pound sign (#112233). "Transparent" is a valid value. |
| Font | Specifies the family name of font in the map. Can be followed by a space and "bold" or "italic". |
| Font Color | Specifies the color of the font in the map; can be either a color name, a decimal RGB value, or a hex RGB value prefixed with a pound sign (#112233). |
| Font Size | Specifies the size, in points, of the font in the map. |
| Hover Color | Specifies the background color for a map region when the mouse pointer is hovered over it; can be either a color name, a decimal RGB value, or a hex RGB value prefixed with a pound sign (#112233). |
| ID | Specifies the element's unique identifier. |
| Include Value in Labels | If working with a datalayer, set this value to 1 to have data values appear in the labels along with region identifiers. |
| Outer Border Color |
Specifies the Specifies of the outer border of the chart canvas; can be either a color name, a decimal RGB value, or a hex RGB value prefixed with a pound sign (#112233). |
| Show Labels | Set this to False if you do not want the labels to be displayed. Default: True |
| Tooltip Column | An automatically-generated tooltip is displayed when the cursor is hovered over each map region, consisting of the data in the Regional Name Column and Regional Value Column attribute values specified earlier, separated by a comma and space. This attribute, Tooltip Column, specifies the name of a datalayer column containing the text for a custom tooltip, which will be shown instead of the automatic tooltip if a value is entered here. You can specify the name of a column returned from the datasource, or that of a Calculated Column you add to the datalayer to create more customized text. |