Analysis Grid - Showing, Hiding, and Moving Columns
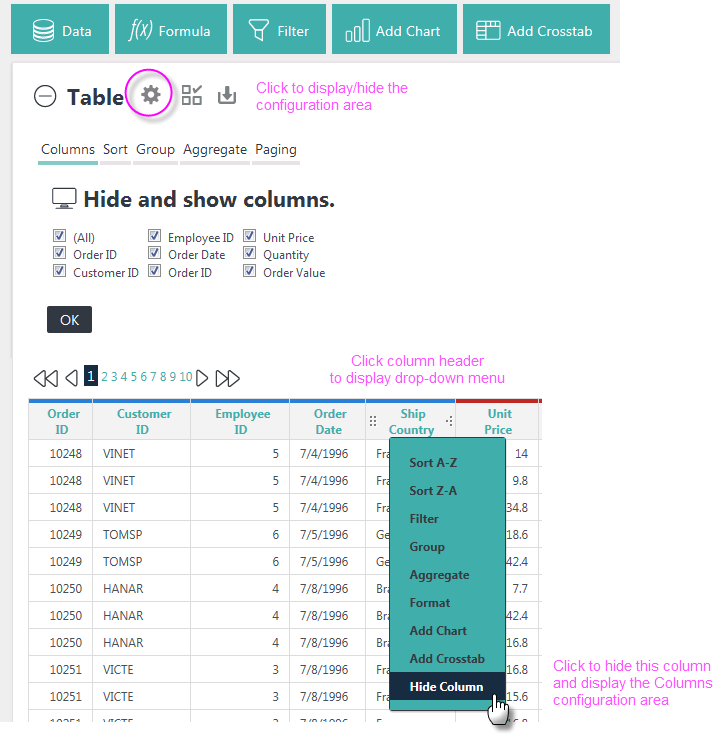
You've selected which data columns to include in your working dataset but you may not want to see them all. The Columns feature in the Table configuration area, which can be displayed by clicking the gear icon or by clicking any table column header, controls column display:

As shown above, you can remove a column from the table by un-checking it.
The (All) check box makes working with lots of columns easier, and you'll need to click OK to refresh the table with any changes. Click the gear icon again to hide the configuration area.
![]() When columns contain multiple cells with the same data, you can visually group contiguous cells by merging them:
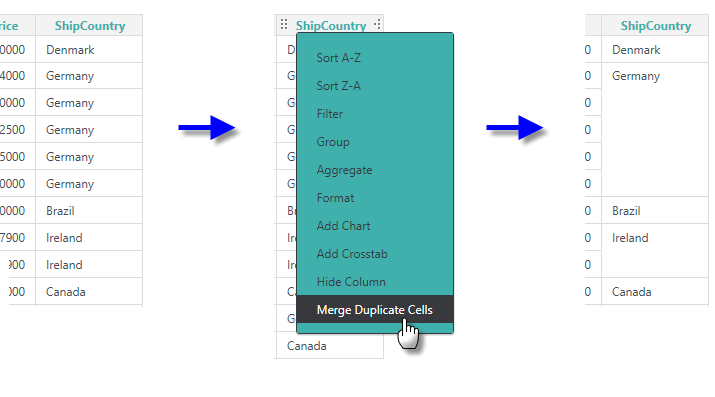
When columns contain multiple cells with the same data, you can visually group contiguous cells by merging them:

To do this, click the column header text and select Merge Duplicate Cells from the drop-down menu, as shown above. The row lines dividing duplicate cell values will be hidden. Use the same steps to reverse the process.

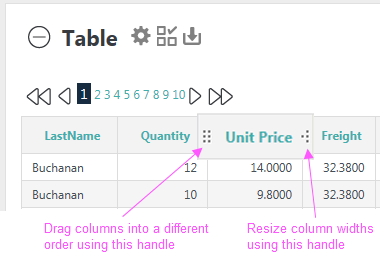
You can also rearrange the order, and change the widths, of table columns using two "drag handles" that appear when you hover your mouse over a column header, as shown above.