Start Creating New Reports
Logi JReport supports three types of reports, Page Report, Web Report and Library Component, to serve different reporting requirements.
- A web report contains only one report and uses .wls as the file suffix. Web reports are the recommended report type for most reports. It is very easy with web reports to build multi-component reports for easy viewing in browsers using on screen navigation to view the data in each component. The only time you should use a page report is for more complex reports that require embedding components inside other components such as subreports inside other report components and report bursting. Web reports are also the most powerful and easy to build ad hoc reports using Web Report Studio.
- A page report is composed of one or more report tabs that are designed for the same purpose, or related purposes. A page report uses .cls as the file suffix. Unless your report requires more complex features you should build a web report. If you cannot build a web report to meet your needs then you must use a page report. The main advantage of a page report is that it supports banded objects which can contain other data components. The biggest disadvantage is that it is much less efficient to interact with a page report from a browser.
- A library component is used by end users to build dashboard using JDashboard and uses .lc as the file suffix. It is not necessary to build library components to use in JDashboard as you can just drag the same components out of a web report to accomplish the same result.
More information about each report type >>
Enable data source
Before you create new reports using Logi JReport Designer, you have to first create a catalog and then create connections to your data sources. Currently, the following methods are provided for you to achieve this goal: via JDBC Connection, XML Connection, SOAP Web Service Connection, MongoDB Connection, HIVE Connection, JSON Connection, or by creating Hierarchical Data Source and User Defined Data Source.
- When the connections are set up, you can then create queries and business views based on tables from the connection, and then use the queries and business views to create reports.
- Hierarchical data sources (HDS) can be used to create page reports directly.
- Moreover, to change the property value of data objects, you should first select File > Options , and then uncheck Forbid editing data object properties in the Catalog category of the Options dialog.
More information about data source connections >>
Creating a web report
- Select Start > Logi JReport 15 > Report Designer to start Logi JReport Designer.
- On the Start Page, select Web Report in the Create category. A blank web report with a tabular of one cell is displayed.
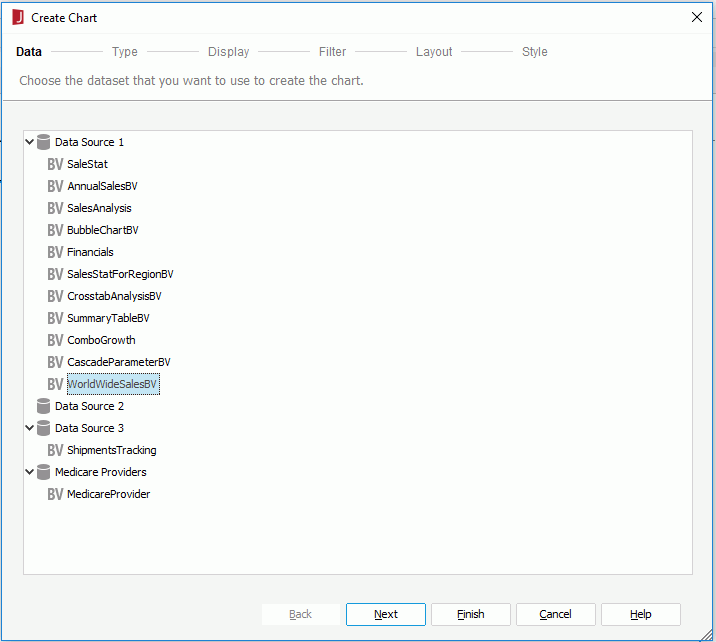
- Select Insert > Chart. The Create Chart wizard is displayed.
- Select a business view in the Data screen.
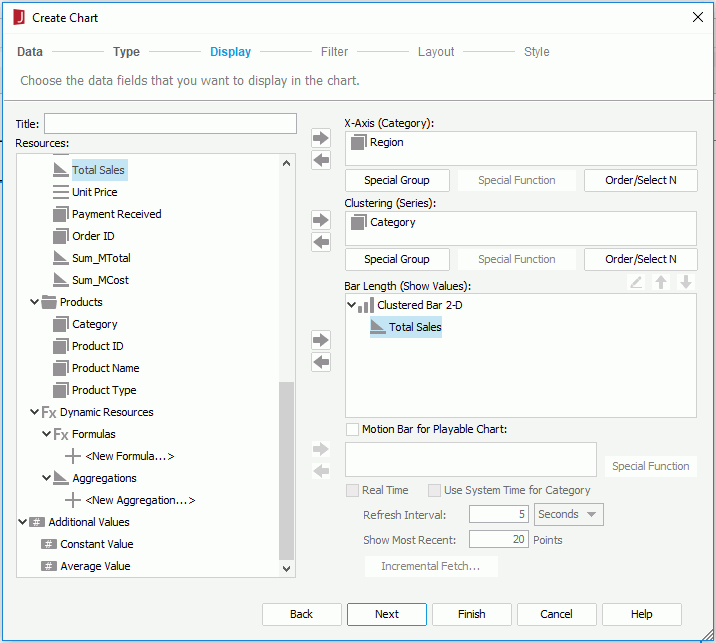
- We will use the default chart type and skip the Type screen. Select Next twice to access the Display screen. Define the data in the chart.
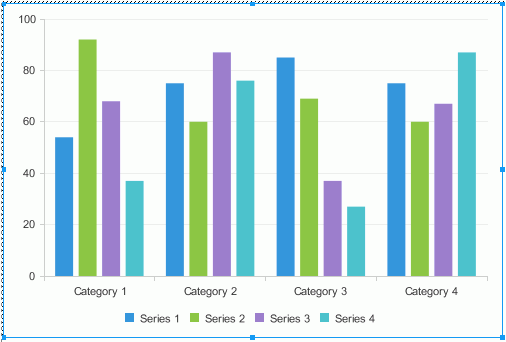
- Select Finish to create the chart.
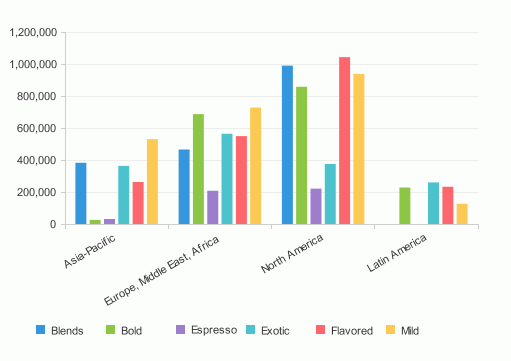
- Select the View tab to preview the web report.
Creating a page report
- In Logi JReport Designer, select File > New > Page Report.
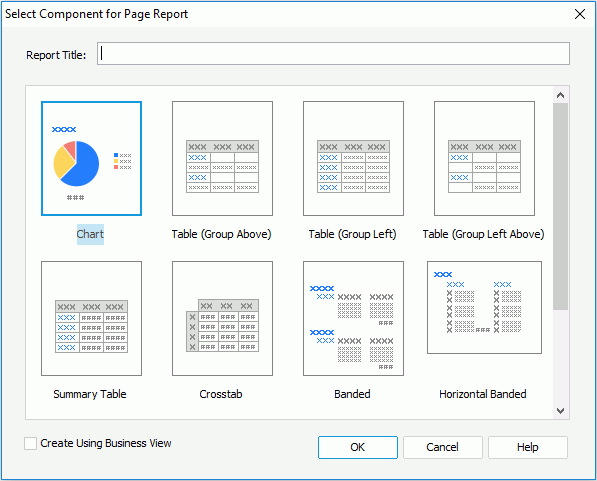
- In the Select Component for Page Report dialog, decide whether to create the page report using business views (by default page reports are query based).
Since a page report cannot be empty, you will also need to create a report tab in it when creating the page report. See the topic "Creating a page report tab" below for more information about page report tabs.
- Select OK to create the report.
Creating a page report tab
Before you can create a page report tab, you first have to create a page report or open an existing page report.
Logi JReport provides you with the following component types to start a page report tab, which are designed for serving different reporting requirements:
- Banded
Creates a report containing a vertical banded object. - Table (Group Above)
Creates a report containing a table with group information above the detail panel. - Table (Group Left)
Creates a report containing a table with group information left to the detail panel. - Table (Group Left Above)
Creates a report containing a table with group information left above the detail panel. - Summary Table
Creates a report containing a table with only group and summary information. - Chart
Creates a report containing a chart. - Crosstab
Creates a report containing a crosstab. - Horizontal Banded
Creates a report containing a horizontal banded object. - Mailing Label
Creates a report containing a banded object in the form of a mailing label layout. - Tabular
Creates a report containing a tabular component. - Blank
Creates a report with nothing in it.
Creating a library component
- In Logi JReport Designer, select File > New > Library Component.
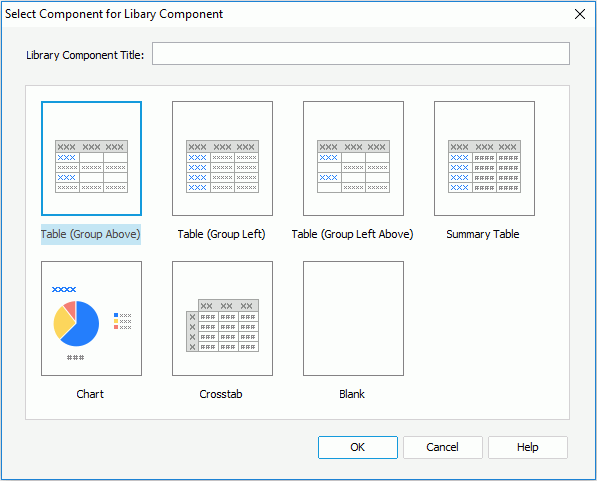
- In the Select Component for Library Component dialog, input a title for the library component and select the component you want to create in the library component.
- Select OK.
- If Blank is selected as the layout, a library component which is blank will be created. You can then use the Components and the Data panels to add objects and view elements to the library component.
- If you select a component type, the corresponding wizard is displayed. Specify the settings according to your requirements.
 Previous Topic