Lesson 6: Creating a Crosstab Report
This topic introduces how to create a Crosstab Report.
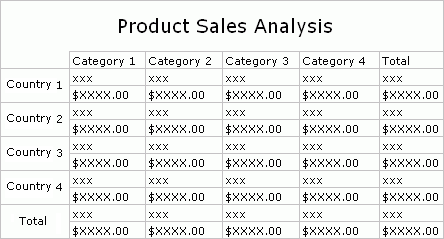
A report with quantities of different products that are sold in different regions and their sales totals is needed. You are required to create a crosstab that can clearly represent the necessary information, which allows the sales manager to easily compare the sales of different products in different regions.
Here is the sketch that is given to you:
Follow the tasks below to finish creating the report:
- Task 1: Create the Crosstab
- Task 2: Format the Crosstab
- Task 3: Change the Page Layout of the Teport
- Task 4: Save the Report Style as a CSS File
Task 1: Create the Crosstab
Before taking this task, make sure you have enabled the Insert field name label with field option in the Options dialog as described at the last step of Lesson 3. Otherwise, the name labels will not be inserted together with the fields when you add fields to the crosstab.
- In Logi JReport Designer select File > New > Page Report.
- In the Select Component for Page Report dialog, select Crosstab and select OK.
Be sure that JinfonetGourmetJava.cat is specified as the current catalog because it is the catalog we use in this track. For information about specifying this catalog, see Task 1, Step 2 and 3 of Lesson 1.
- In the Data screen of the Crosstab Wizard, select <New Query...> in the Queries node of Data Source 1, input ProductSalesAnalysis in the Enter Query Name dialog and select OK.
- In the Add Tables/Views/Queries dialog, expand the JDBC connection node and then the Tables node, then select the Customers, Orders, Orders Detail and Products tables and select
 to add them to the query. Select OK to close the dialog.
 - In the Query Editor, the tables are joined together automatically based on the auto join criteria. Check all the columns in the Orders Detail table by selecting the * checkbox. For the Customers table, check the following columns: Customer Name, Customers_City, Customers_State, Customers_Country, Customers_Territory and Customers_Region, and for the Products table, the following columns: Products_Product ID, Product Name, Category, Product Type Name and Price.
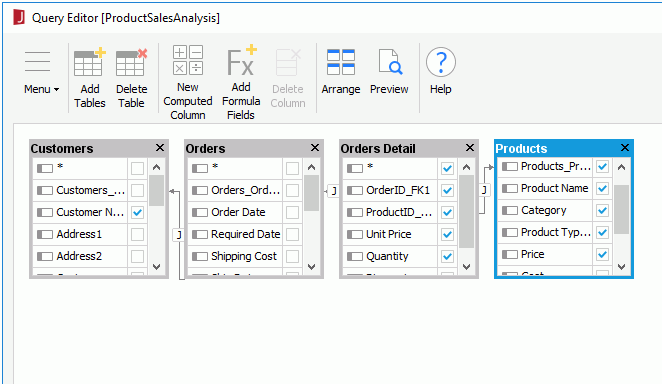
You may notice that here we do not check any columns in the Orders table, that is because in this report, columns in this table are not needed but we need this table to create joins between tables in the query.
- Select OK at the bottom of the Query Editor to create the query. Then select Next in the Crosstab Wizard.
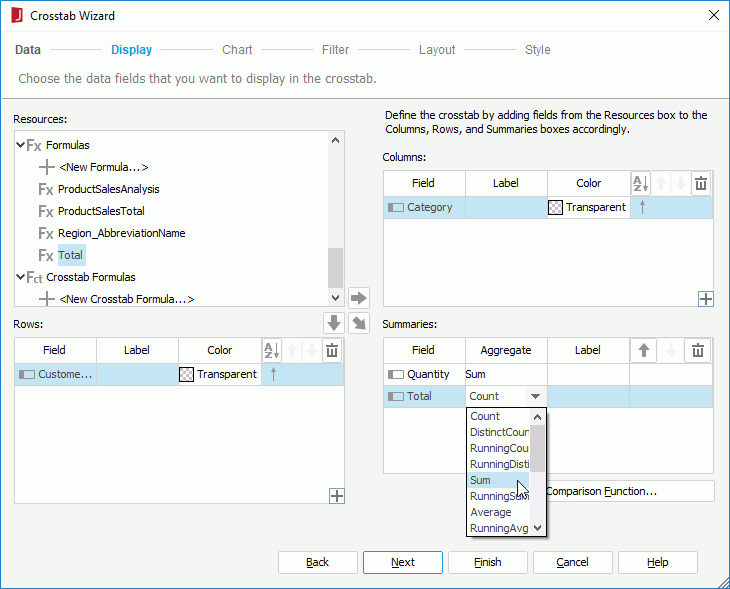
- In the Display screen, add the DBField Category to the Columns box by selecting it and selecting
 , add Customers_Country to the Rows box by selecting it and selecting
  , add the Quantity DBField and Total formula to the Summaries box by selecting them and selecting
  one by one, and then double-click in the Aggregate text box and select Sum from the drop-down list to change the aggregate function of the two summaries.
- Select Style to switch to the screen and select Simple from the Style list, then select Finish to create the crosstab report.
Task 2: Format the Crosstab
In this task, we will format the crosstab to make it look more professional.
- Right-click on the crosstab and select Position > Absolute, then drag it to the following position:
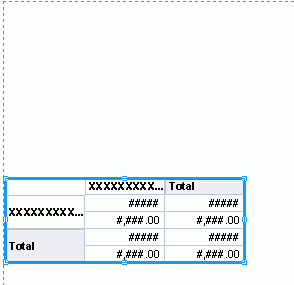
By setting the Position property of an object to absolute, the object will be located at the position specified by dragging and dropping or by setting its X and Y coordinate property values.
- Drag
 from the Basic group in the Components panel to add three labels in the report, then double-click each label to edit the text respectively to Product Sales Analysis, Units and Sales. Resize and adjust the crosstab and the three labels to place them as follows:
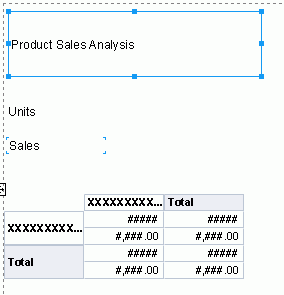
Next, we will edit properties of the crosstab report objects in the Report Inspector to improve the appearance of the report.
- Select the Units label and edit its Bold property to true, Background property to Gray and Foreground property to White.
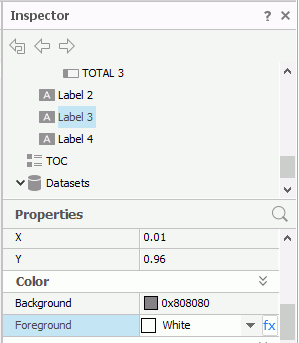
- Select the Sales label and edit its Bold property to true, Background property to 0x99ccff and Foreground property to White.
- Select the field on the column header (Category field) and edit its Background property to 0x99ccff and Foreground property to White.
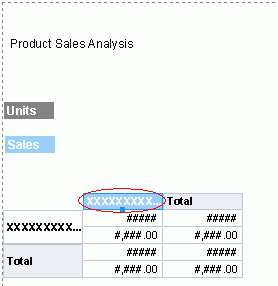
Select the two Total cells, the field on the row header (Customers_Country field) and the four ##### cells in the crosstab by holding the Ctrl key on the keyboard, and then specify their Foreground property to Gray.
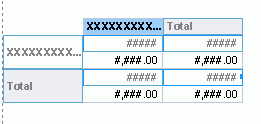
- Select the four #,###.00 cells by holding the Ctrl key on the keyboard, change their Foreground property to 0x99ccff, Bold property to true and Format property to $#,###.00.
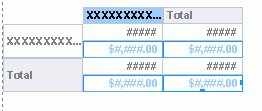
- Select the Product Sales Analysis label, set its Bold property to true, Font Size property to 18, and Foreground property to Red, then resize it to make its text not be truncated.
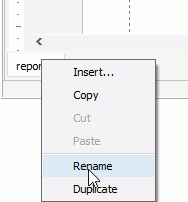
- On the report tab bar, right-click the report tab and select Rename to rename it to ProductSales.
- Select File > Save to save the report as ProductSalesAnalysis.cls.
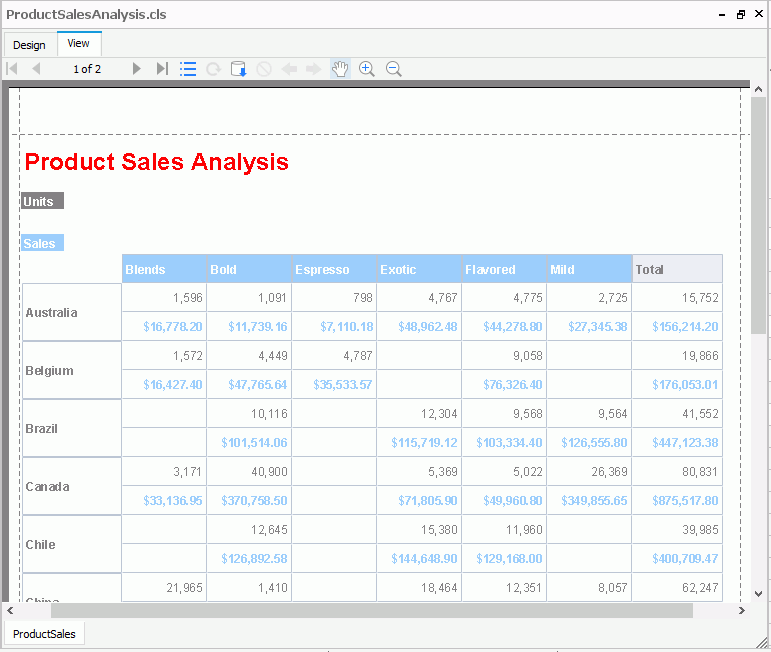
- Select the View tab, and the crosstab report appears somewhat like the following one:
Note: If the report does not look correct, you can compare it to the final version of the report provided by Logi JReport. To do so, you will need to save and close this catalog and then open the JinfonetGourmetJava.cat catalog file located at
<install_root>\Demo\Reports\TutorialReports.
Task 3: Change the Page Layout of the Report
When previewing the report, we can see that the crosstab is displayed in two pages. While for a crosstab such a layout is not convenient for users to analyze data. Logi JReport provides the Page Mode feature, using which users can specify how to layout the report pages: in pagination mode or continuous mode. When a report is displayed in continuous mode, the whole report will be laid out in a single page.
- Select View > Page Layout.
- Select the View tab to view the report again. Now, the crosstab is displayed in a single page. We can drag the scroll bar to have a complete view of the crosstab.
For a crosstab component, when it is in continuous page mode, we can further set another two properties to determine how many rows and columns we would like to view.
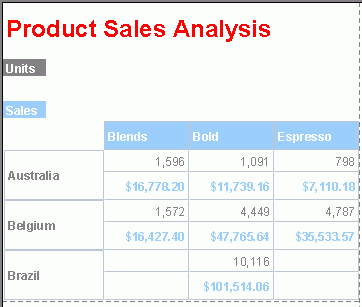
- Select the crosstab, and set its Items per Row Block and Items per Column Block property values to 3 in the Report Inspector.
- View the report. Now only three items are displayed in the row and column blocks.
- Check Page Layout on the View menu to switch back to the pagination mode, then the two properties will not take effect.
- Select File > Save to save the report again.
Task 4: Save the Report Style as a CSS File
After formatting the report step by step in the Task 2, we can then save the properties into a CSS style file, which can be applied to other crosstab reports directly.
- Select the crosstab, right-click and select Save Style from the shortcut menu.
- Keep the default settings in the New CSS Style dialog and select OK.
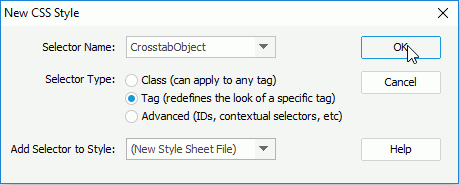
- In the Save CSS As dialog, enter Crosstab.css in the File Name field, then select Save to save the file to the default directory
<install_root>\style.The CSS Style Definition for CrosstabObject dialog appears.
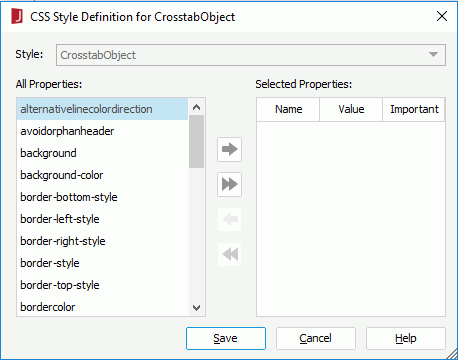
- Add all the properties of the crosstab from the All Properties box to the Selected Properties box by selecting
 , then select Save to save these properties in the crosstab.css file.
Now, the style of the crosstab report has been saved as a CSS file. Properties in the file can be applied to corresponding components of other reports directly by selecting the CSS file in the <Import CSS File...> drop-down list on the toolbar of Logi JReport Designer.
 Previous Topic