Lesson 1: Creating a Standard Banded Report
This topic introduces how to create a Standard Banded Report.
A report of monthly sales for the last two years has been requested by the Vice President of Sales at Jinfonet Gourmet Java. In this report, totals for sales need to be broken down by each order and each month, as well as presented for a grand total of all months.
Here's a draft of the report the vice president has given to you:
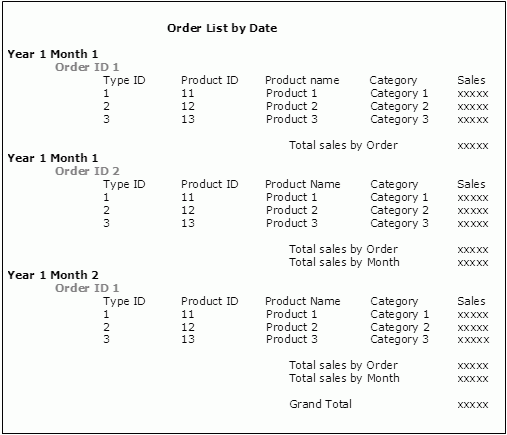
You immediately recognize the repetitive, columnar data in the center of the report and associated subtotals as a candidate for a standard banded report. This type of report has horizontal "bands" or panels that are geared for either detailed record display or calculations, such as subtotals, that apply to a preceding group or the entire report.
Follow the tasks below to finish creating the report:
- Task 1: Create the Initial Report and Query to Populate It
- Task 2: Add Summaries and a Print Date to the Report
- Task 3: Fine Tune the Report Layout
Task 1: Create the Initial Report and Query to Populate It
In this task, the report wizard collects the necessary information and then creates the standard banded report. The data resources such as query and formulas needed in the report can be created via the report wizard.
- Select Start > Logi JReport 15 > Logi JReport Designer to start Logi JReport Designer. The Logi JReport Designer window with the Start Page appears. Close the Start Page.
- Cick File >Open Catalog.
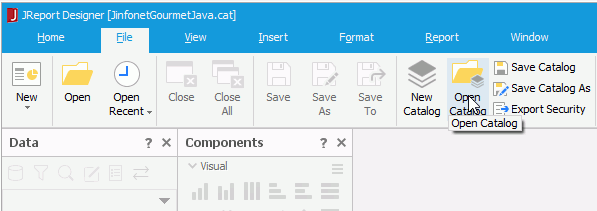
The Open Catalog File dialog appears.
- Browse to select the JinfonetGourmetJava.cat catalog file in
<install_root>\Demo\Reports\JinfonetGourmetJava, select the Open button, and then select Yes in the Warning dialog.The Catalog Manager appears for managing the selected catalog. Close it since we will not use it in the lesson.
- Select File > New > Page Report.
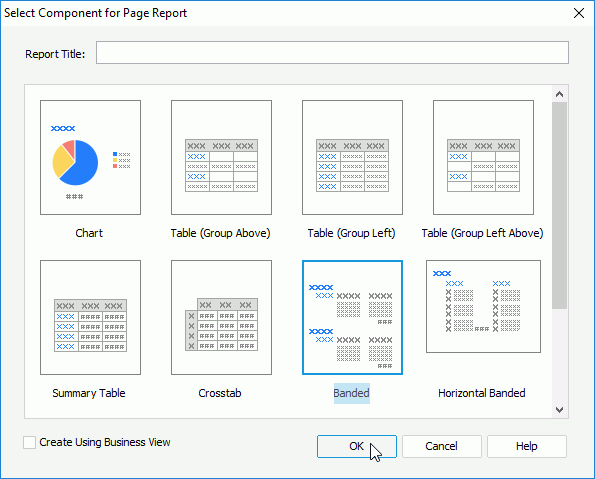
- In the Select Component for Page Report dialog, select Banded, then select OK.
- In the Data screen of the Banded Wizard, select <New Query...> in the Queries node of Data Source 1, input OrderListbyDate in the Enter Query Name dialog and then select OK.
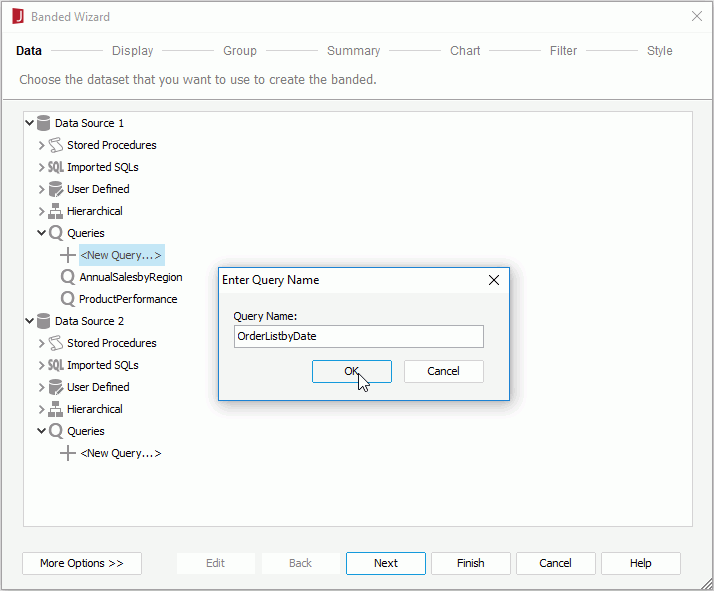
Queries are a higher-level object in a catalog. The concept is similar to that of views in the database but they are stored in the catalog file rather than the database itself. You can use queries to view, change and analyze data in different ways, and Logi JReport can help you with the building of various professional reports based on queries.
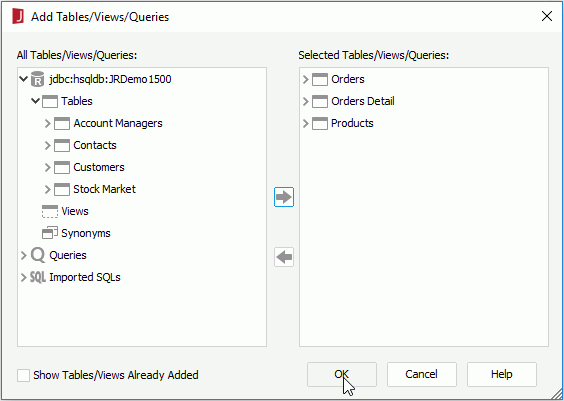
- In the Add Tables/Views/Queries dialog, expand the JDBC connection node and then the Tables node, then select the tables Orders, Orders Detail and Products and select
 to add them to the query. Select OK to close the dialog.
- In the Query Editor, select all the columns in the three tables by selecting the * checkbox, then uncheck the Inventory and Reorder Level columns in the Products table. The selected columns will be added to the query and can be used for creating reports.
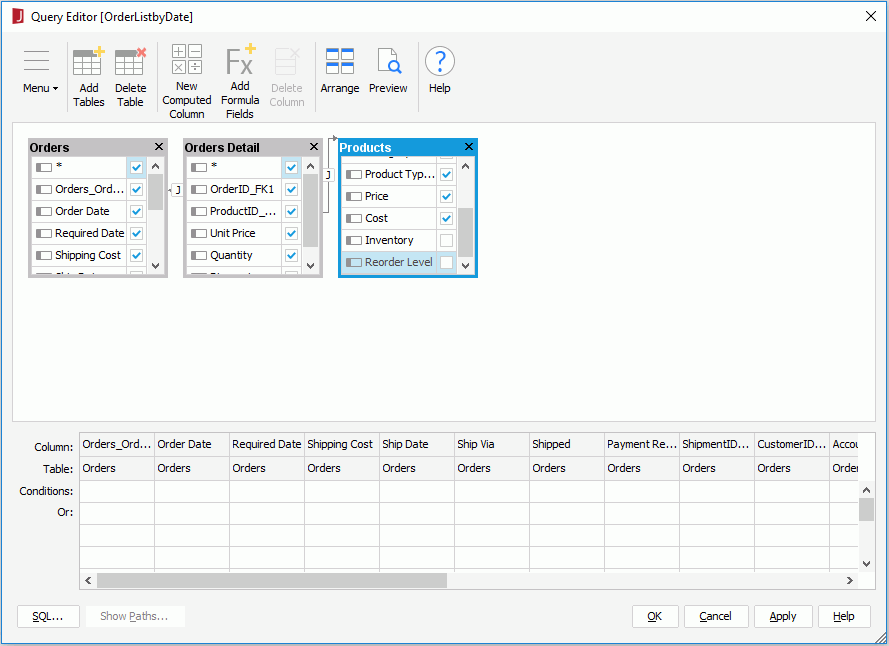
By default, the auto join options for queries are enabled (you can find the options on the sub menu of Query > Auto Join in the Query Editor), which means tables will be automatically joined in queries based on the join criteria. So, the three tables are automatically joined because Logi JReport Designer recognizes the matching rows in each table. You can modify the join if desired or customize a different join for set of tables.
Logi JReport creates the SQL SELECT statement based on the columns, tables, and joins you specify. Select the SQL button to see the SQL SELECT statement if necessary.
- Select OK at the bottom of the Query Editor to create the query.
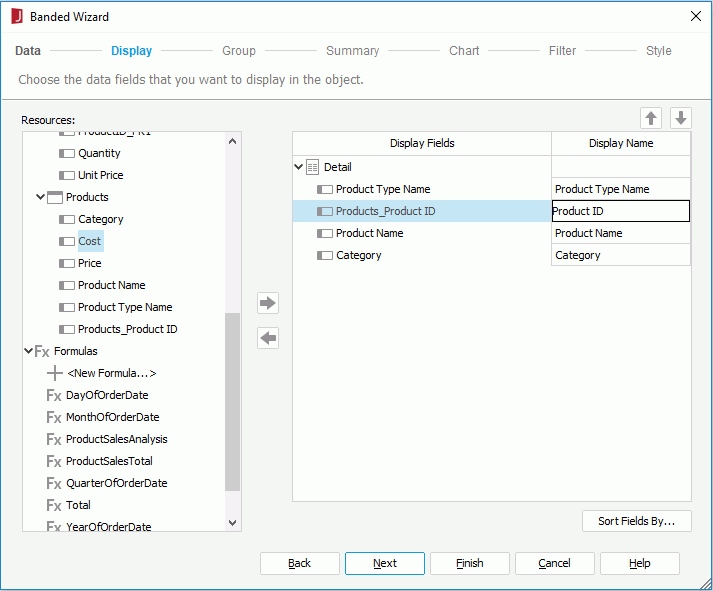
- Select Next in the Banded Wizard to show the Display screen. The Display screen determines which fields returned by the dataset are visible in the report.
- From the Resources box, drag and drop the following fields in the Products table to the right-hand box one by one: Product Type Name, Products_Product ID, Product Name and Category, then change the display name of Products_Product ID to Product ID.
- Select Next to display the Group screen. The Group screen specifies the grouping criteria to be applied to the selected records.
There are two levels of grouping in this report: first by Order Date and second by Orders_Order ID.
- From the Resources box, select the fields Order Date and Orders_Order ID in the Orders table and select
 to add them as the group by fields one by one.
You can choose the sorting sequence of the groups in the Sort column. Specify it in descending order (c,b,a), ascending order (a,b,c) or a special ordering criteria. By default the order is Ascend.
- Select For each month from the Special Function drop-down list for the Order Date group.
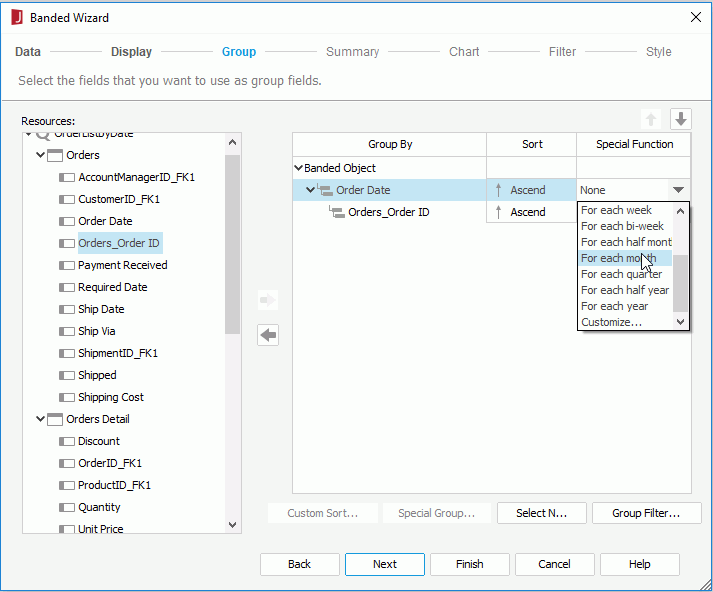
By selecting the for each month special function, the records, of which the field values are in the same month, will be grouped together.
- Select Style to switch to the screen and select Simple from the Style list. The Summary, Chart, and Filter screens are skipped.
By default, when you create a banded, table, crosstab or chart report via the report wizard, a default style Basic will be applied to it. However, in this lesson, we want to customize the report style by ourselves, so here we select the Simple style which has very little formatting.
- Select Finish to create the report.
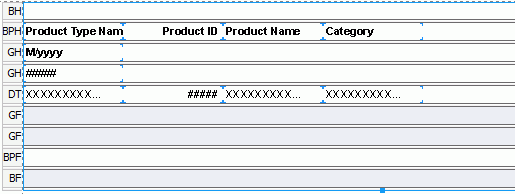
The report with banded object is created. The panels in the banded object are identified on the left side by their abbreviations: a banded header panel (BH), a banded page header panel (BPH), a detail panel (DT), a banded page footer panel (BPF), a banded footer panel (BF), and two group header panels (GH) and group footer panels (GF) for the two levels of grouping:
Select the View tab to run the report and view it.
Task 2: Add Summaries and a Print Date to the Report
As it is described in the first paragraph of this lesson, you need to calculate the totals of sales per order and per month, and then the total of all months. These types of calculations can be accomplished by defining a dynamic summary that performs the computation and placing it in the group footer panel directly. A print date is a predefined field that is calculated at runtime by Logi JReport.
First we need to add a field to the report that calculates the sales data. The predefined formula Total turns out to meet the requirement. The formula expression is as follows: @"Unit Price" * @Quantity - @"Unit Price" * @Quantity * @Discount/100.
- From the Data panel, drag the Total formula in the Formulas node and drop it next to the Category DBField. The label of the formula is then placed in the second GH panel as follows:

The Data panel is an integrated interface for managing the resources that are used in the current report. You can create new resources including formulas, summaries and parameters to use in the report and they will be saved into the current catalog data source.
Next, we will create a dynamic summary based on the Total formula, so as to compute total of product sales by order, by month and also to calculate the grand total.
- In the Data panel, select <New Summary...> in the Summaries node.
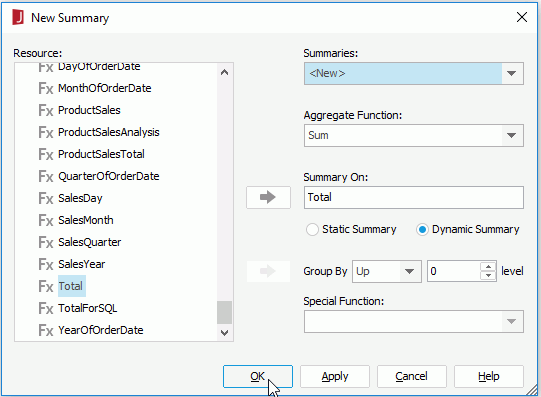
- In the New Summary dialog, choose Sum from the Aggregate Function drop-down list, select the Total formula in the Formulas node of the Resource box and select
 to add it to the Summary On field, check the Dynamic Summary radio button and keep its default settings, then select OK.
- Input Sum_ProductSales_DynamicSummary in the Enter Summary Name dialog and select OK to create the summary.
Then when we insert this summary into the groups. Logi JReport will do the calculation based on the groups. If the summary is inserted into the banded header or banded footer panel, it will compute based on the whole banded report.
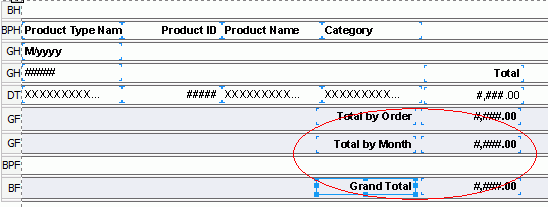
- Drag the summary Sum_ProductSales_DynamicSummary from the Summaries node of the Data panel to both of the two GF panels as well as the BF panel.
- Double-click the label for each of the newly added summaries to edit the text to Total by Order, Total by Month and Grand Total respectively.
- Resize the BPH panel and drag
 from the Basic group in the Components panel to add a label in it.
 - Resize the newly-added label and double-click it to edit its text to Order List by Date.

- Select Insert > Special Fields > Date-time > Print Date and then place the special field in the BPH panel, next to the Order List by Date label.
- Insert the Print Time special field in the same way.

- Double-click the Print Date and Print Time labels and edit their text to Date and Time, respectively.
- Adjust the position of the two groups by fields, add two labels ahead of them for identification and edit their text as Order Date and Order ID as follows:

Task 3: Fine Tune the Report Layout
To make the report easier to read, we need to make some adjustments to the report layout.
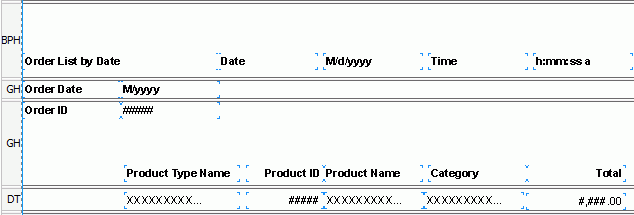
- Resize the second GH panel. Select the Product Type Name, Product ID, Product Name and Category name labels in the BPH panel by holding the Ctrl key on the keyboard and move them to the second GH panel, so that they can be closer to the actual data they describe.
- Resize the Product Type Name, Product ID, Product Name, Category and Total name labels, as well as their corresponding DBFields, manually drag and align them as follows:
- Select the Product ID name label and the corresponding DBField in the DT panel by holding the Ctrl key on the keyboard, then select Format > Left
 to change their alignment so as to improve the report layout.
 - Select the five labels Product Type Name, Product ID, Product Name, Category and Total by holding the Ctrl key on the keyboard, then in the Report Inspector, set their properties Background and Foreground to Lightgray and White.
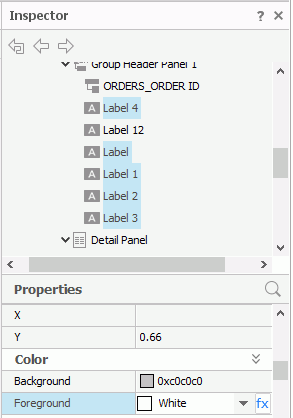
- Select the Total by Order and Total by Month summaries as well as their name labels by holding the Ctrl key on the keyboard, then change their Foreground property to Gray in the Report Inspector.
- Select the Grand Total summary and its name label in the BF panel by holding the Ctrl key on the keyboard, then change the Foreground property to Red in the Report Inspector.
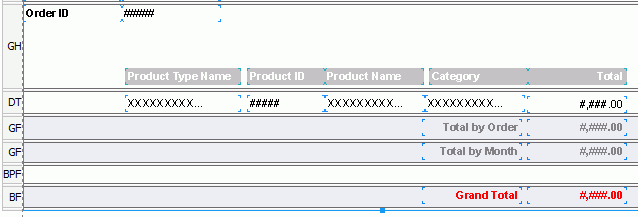
- Select the Order ID group by field and its name label in the second GH panel by holding the Ctrl key on the keyboard and change their Foreground property to Red in the Report Inspector.
- Select the Date and Time special fields in the BPH panel and the Order Date group by field in the first GH panel with their name labels by holding the Ctrl key on the keyboard, then change their Foreground property to Gray in the Report Inspector.
- Resize the Order List by Date label, change its Font Size property to 18, and Foreground property to Red in the Report Inspector.
- Resize the Date and Time special fields and their name labels and change their position in the BPH panel to make them look tidy in the report.
- In the Report Inspector, select the nodes representing the two group footer panels and the banded footer panel by holding the Ctrl key on the keyboard, then set their Background property to Transparent.
- Right-click in the BH panel and select Hide from the shortcut menu to hide it from view. Repeat to hide the BPF panel in the same way.
After editing, the report looks somewhat like below in design view:
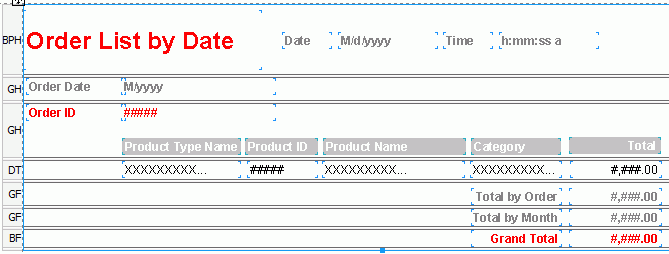
Next, we will give the report tab a meaningful name and save the report.
- On the report tab bar, right-click the report tab and select Rename from the shortcut menu.
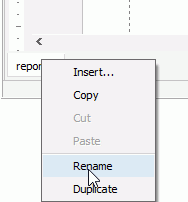
- In the Input Report Tab Name dialog, enter OrderDetails and select OK.
- Select File > Save to save the report as OrderListbyDate.cls.
Select the View tab to run the report and view it. The report should look similar to the following one:
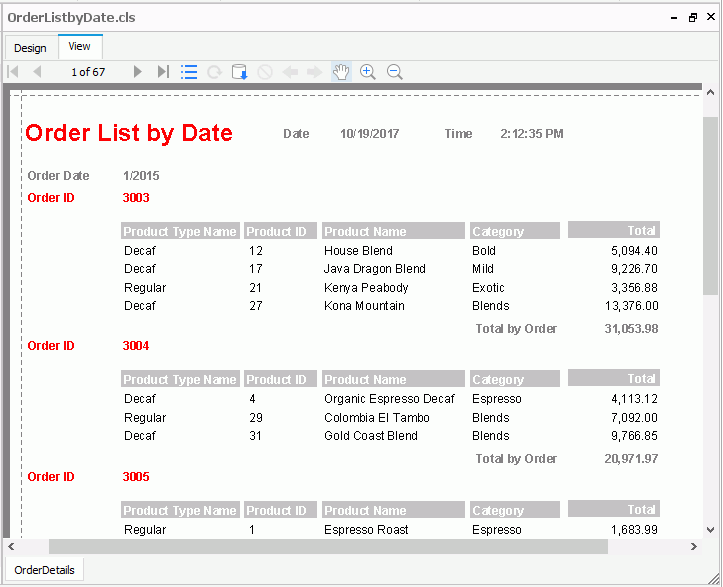
Note: If the report does not look correct, you can compare it to the final version of the report provided by Logi JReport. To do so, you will need to save and close this catalog and then open the JinfonetGourmetJava.cat catalog file located at <install_root>\Demo\Reports\TutorialReports.
 Previous Topic