Work with jQuery
jQuery is a popular, cross-browser JavaScript library designed to simplify client-side scripting. It's widely used and can be integrated in Logi applications, allowing developers to take advantage of a variety of components, effects, and features.
IMPORTANT: If you wish to upgrade to JDK 8 release build 261 (1.8.0_261), or any later build of JDK 8, you will need to replace the mscorlib.jar file in the application folder with the new one and restart your server. The mscorlib.jar file can be found on our Product Download page. Please contact Support for additional assistance.
This topic discusses how to work with jQuery and the JSON data format within Logi definitions.
- About jQuery and JSON
- Including and Using jQuery Components
- Convert XML Into JSON Data
- Convert JSON Data Into XML
About jQuery and JSON
jQuery is a fast and concise JavaScript Library that simplifies HTML document traversing, event handling, animating, and Ajax interactions for rapid web development and is the most popular JavaScript library in use today. jQuery is free, open source software and provides capabilities for developers to create plug-ins on top of the JavaScript library. You can download the library and documentation and learn more at the official jQuery website.
Logi Info and Logi Report feature elements that make it easy to include the jQuery libraries, either from local copies or remotely via a URL, in your report definitions.
Google provides free online access to a number of development API libraries, including jQuery and jQuery UI. This allows you to work with jQuery without having to maintain a local copy of the libraries and the examples in this topic use this approach. More information is available at the Google Libraries API web page.
JavaScript Object Notation, or JSON, is a lightweight, text-based, open standard for data interchange and works with jQuery. It's derived from the JavaScript language for representing simple data structures and associative arrays. The JSON format is used primarily to transmit data between a server and web application, serving as an alternative to XML. More information is available at the JSON website.
Logi Info and Logi Report feature elements that make it easy to retrieve data from JSON data files into standard Logi datalayers and to convert datalayer XML data to the JSON format.
Include and Use jQuery Components
Here are two examples that illustrate how to include the jQuery libraries and jQuery code. The first on displays the "date picker" UI component:
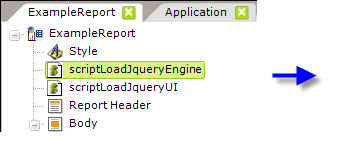
First, configure your report definition's Style element to use an online Google API style sheet:
http://ajax.googleapis.com/ajax/libs/jqueryui/1.8/themes/base/jquery-ui.css
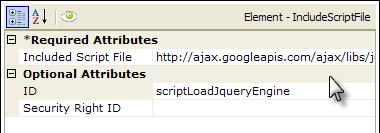
Then add two Include Script File elements to your definition, as shown above, and configure their attributes to include an online version of jQuery libraries available from Google. The two URLs used are:
http://ajax.googleapis.com/ajax/libs/jquery/1.6.2/jquery.min.js
http://ajax.googleapis.com/ajax/libs/jqueryui/1.8.16/jquery-ui.min.js
You could, of course, use local copies of the jQuery libraries, downloaded into _SupportFiles, and enter their filenames instead.
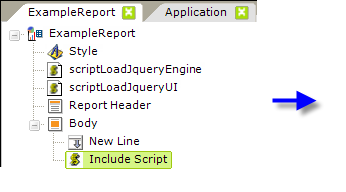
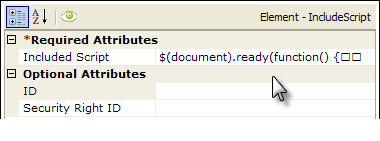
Next, add an Include Script element and enter the jQuery code in its Included Script attribute, as shown above. The full code is:
|
And finally, add a container (a Division element) for the date picker:
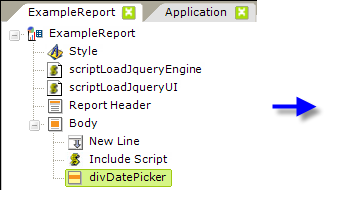
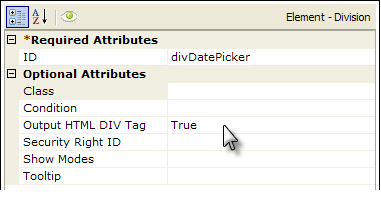
as shown above. Notice that the ID of the division is used in the jQuery code, which is case-sensitive.
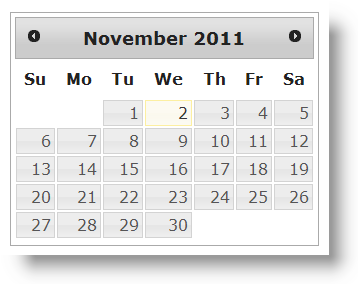
When you run the report, you should see a fully-operational date picker calendar similar to the one shown above.
The jQuery News Ticker
The next example showcases a little more integration with standard Logi elements. It uses a datalayer as the source for "news headlines", one of which is displayed for a fixed interval before being replaced by the next headline, a classic "news ticker".
Begin by adding the following two style classes to a local style sheet:
#ticker li { |
Then assign that style sheet to your report definition, using the Style element.
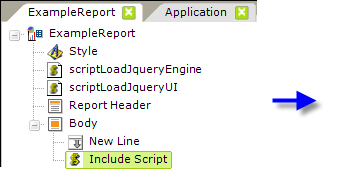
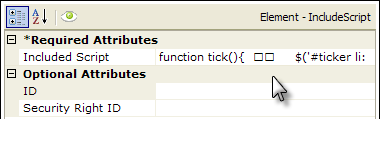
Use the same two jQuery libraries as before and an Include Script element, as shown above. The complete jQuery code, for its Included Script attribute value, is:
setInterval(function(){ tick () }, 4000) |
Note that there is only one long line of code in function tick( ) but it may have wrapped to look like two lines in your browser.
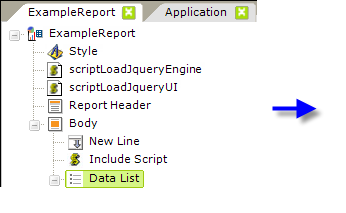
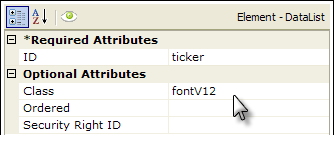
Now, add a Data List element in the report Body, as shown above. Its ID, "ticker", matches entries in the jQuery code and CSS, so you need to enter it exactly as shown. Assuming your style sheet included a 12pt Verdana font class, assign it here for the headline display.
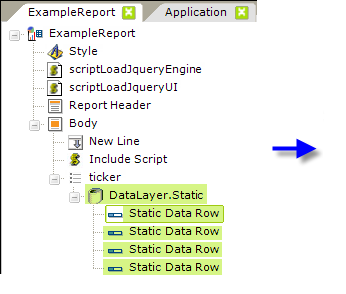
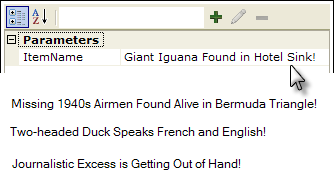
Next, add a DataLayer.Static element and four Static Data Row elements. This, of course, could be any type of datalayer. Set the four data row elements to each have a single column called "ItemName" and enter one of the four headlines for each element, as shown above.
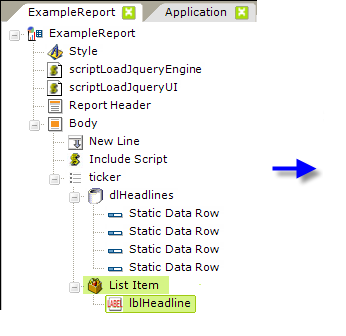
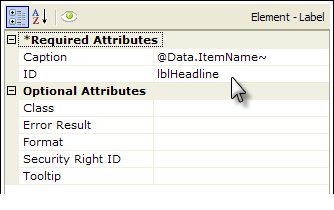
Finally, add a List Item element and, beneath it, a Label element. Set the Label attributes as shown above.
So - what you've created is a datalayer-driven, HTML un-ordered list and the jQuery code will display one line of the list at a time.
![]()
Run the application and you should see something like the example above, with each headline rotating through it. Note that, if you're using IE 8 or earlier IE versions, the font will change appearance slightly after all the headlines have been shown once.
Now you can begin to see how the jQuery code can interact with other HTML components created by Logi elements, with CSS, and with data from a datalayer. The next sections look at data manipulation in more detail.
Manage JSON Data Columns
Normally, the Json Data element will output all of the columns in the datalayer, using the same column names. However, in v10.2.002, a new child element, Json Column, was introduced that lets you manage the output columns. You include a Json Column element for each datalayer column that you want to output; which means you can output fewer that all the datalayer columns if you desire. The element's attributes let you specify a different name for the column and its data type in the output as well.
Convert XML Into JSON Data
Many jQuery objects and plug-ins work with data in the JSON format. One way to get data into this format in a Logi report is to use the JSON Data element. This element runs a Logi datalayer and inserts the result set into a JavaScript array in the report. This enables browser-side components, such as JQuery components, to use and display the data.
There are two options for including the data in a report: Inline and File. If the Inline option is selected, the data is embedded as an array directly into the HTML between <SCRIPT> tags. If the File option is chosen, the data is written out as an array to a temporary file in your app's rdDownload folder and included using a <SCRIPT SRC= filename.js> tag. In both cases, your jQuery code uses the array variable name to access the data.
In many cases, the array object will match the data format expected by your jQuery code but, in some, it may not, in which case you may need to write a little JavaScript code to extract the data you need.
Here's an example, using the jQuery AutoComplete widget.
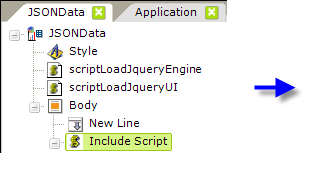
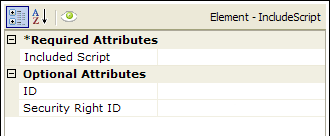
Start by using the same Style and Include Script File elements, and their settings, from the first example in this topic. Then add an Include Script element beneath your report definition's Body element, as shown above. We'll come back and write its script later.
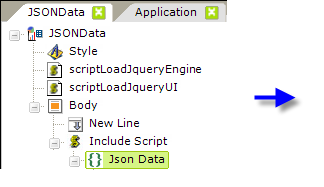
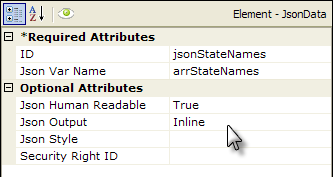
Beneath the Include Script element, next add a JSON Data element and set its attributes as shown above. Its unique attributes are:
- Json Var Name - This attribute specifies the variable name to be used for the data array, which is used in the jQuery code.
- Json Human Readable - Specifies whether spaces and LFs are used to format the output JSON data, for easier debugging.
- Json Output - Specifies whether the data array will be embedded directly in the HTML (Inline) or included as a external file (File). Using an external file might help with performance for larger data volumes or might help by shielding the data from examination using View Source.
- Json Style - Added in v10.2.002, this attribute specifies the format of the data output; either as RowsToObjects or as ColumnsToPropertyArrays. See the discussion below with output examples. Default: RowsToObjects
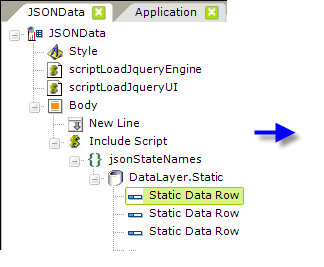

Next, add a datalayer beneath the JSON Data element. This could be any type of datalayer, but we'll use DataLayer.Static to make it easy to see the data. Add seven Static Data Row elements beneath it, adding values to a column named "Name". The values should be "Alabama", "Alaska", "Arizona", "Arkansas", "California", "Colorado", and "Connecticut".
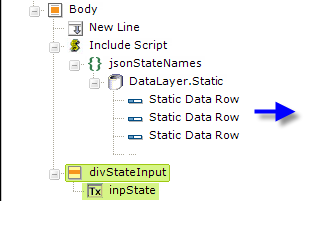
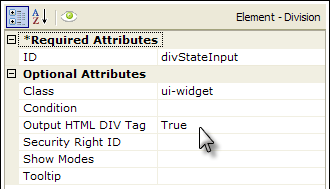
Finally, add a Division element and a child Input Text element beneath the Body, as shown above. Set the Div's attributes as shown, and you can add a Caption to the input element, if you'd like.
|
| |||
|
|
If you Preview the application right now, then right-click and select View Source to see the underlying HTML, you should see the data embedded in the HTML, as shown above. This is the JavaScript array of data in JSON format, shown using the two different formatting styles available.
var data = [ |
|
| ||
|
|
Here's another example, shown above, which is unrelated to our exercise but which includes multiple columns, to further illustrate the effects of the Json Style attribute. RowsToObjects serializes datalayer rows into an array of objects, where each object represents a data row and the objects have a property for each column. ColumnsToPropertyArrays serializes the datalayer into a single object, where each column is a property with all the row values contained in an array.
Now go back to the exercise definition and add in the JavaScript code: select the Include Script element and enter the following as its Included Script attribute value:
$(document).ready(function() { |
You'll recognize the bottom section as jQuery code; note the use of the input control ID ("inpState") and temporary array variable name ("arrTemp") in it. The upper section creates the temporary array from the JSON data, because the widget is expecting a one-dimensional array of strings, while the JSON data is, as we've seen, two-dimensional.
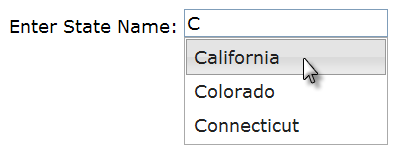
If you Preview the application now, you should see the Input Text control. If you type the letter "C" into it, a list of the choices that begin with that letter will appear. Typing more characters will narrow the list further. Try typing "A", as well.
You may care to go back and change the JSON Data element's Json Output attribute to File, Preview again, and then examine the temporary file created in rdDownload. It will have a GUID filename with a .js extension.
Convert JSON Data Into XML
The previous section demonstrated how XML data retrieved with a datalayer could be converted into JSON data for use with jQuery components that work with that data. The section describes the reverse: how to retrieve JSON data and turn it into XML data for use with Logi elements.
This example gets a weather forecast from Yahoo in JSON format, using a special datalayer, DataLayer.JSON File, and converts it to regular Logi XML data.
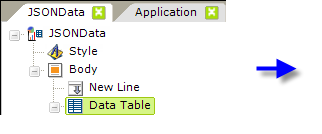
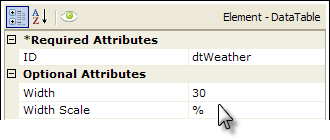
Start this example by setting the Style element to one of the standard Logi Analytics Themes but don't use a style sheet. You won't need to include any script files, either.
Add a Data Table element and set its attributes as shown above (blank attributes were removed from the image).
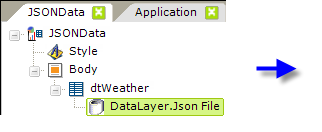
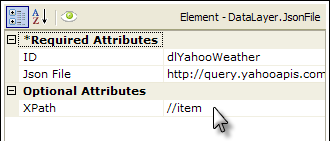
Next, add a DataLayer.JSON File element beneath the data table, as shown above. Here's the complete value to use for the Json File attribute value:
http://query.yahooapis.com/v1/public/yql?q=select%20item%20from%20weather.forecast%20where%20location%3D%2222102%22&format=json
This may wrap in your browser, but it's all one line. Note that the highlighted bit is a U. S. postal Zip Code, which determines the forecast location.
The Json File attribute value can be either a fully-qualified file path and name (such as c:\myfolder\mydata.js) or a location on the web (such as http://server/data.js). By default, the server will look in the app's _SupportFiles folder, in which case you can simply specify the filename (such as mydata.js).
Note that we're also using XPATH to extract the data we want from the returned data. You may want to turn on debug and look at the data in the various stages of processing.
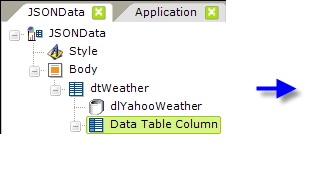
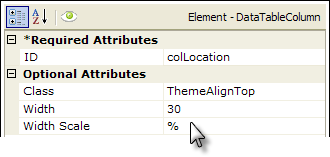
Next, add a Data Table Column element and set its attributes as shown above.
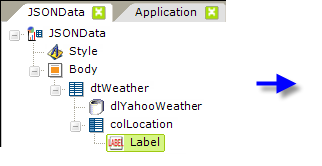
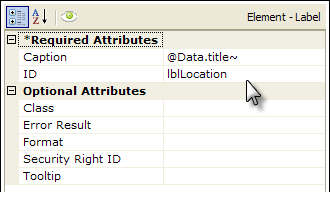
Followed by a Label element to display the data, as shown above.
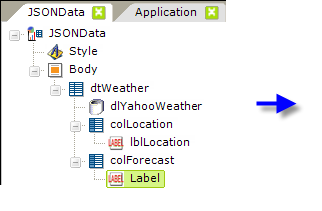
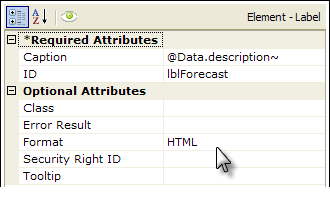
Finish by adding another Data Table Column and Label combination. The attributes for the Data Table Column should match the previous one, but leave the Width and Width Scale attributes blank. Set the Label attributes as shown above.
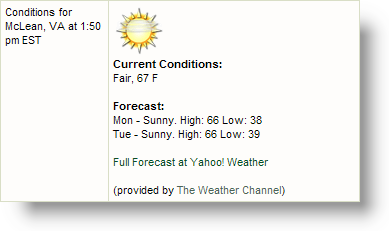
If you Preview the report now, you'll see the local forecast for the specified zip code, which might look like the example above.
In summary, we've seen how jQuery can be used in Logi report definitions, how XML data can be included as JSON data, and how JSON data can be converted to XML for use with Logi elements. A final, important reminder: jQuery, like all JavaScript, is case-sensitive and you can head off many errors by paying strict attention to case.