Animated Maps
Logi Info includes Animated Maps, which are animated, interactive, data-driven, Flash-based maps, for your Logi applications. Data range coloring makes it easy to relate data within specified thresholds to map regions.
- About Animated Maps
- The Animated Map Element
- Reference Data
- Add Color Ranges
- Use a Color Spectrum Legend
- Available Maps
- Sample Application
About Animated Maps
Logi Info's Animated Maps are animated, interactive, data-driven, Flash-based maps for Logi applications. Developers can use them to display geographical data distributed by category, regions, or entities. The best usage examples include statistical display of data, flight routes, office locations, election results, survey results, or business intelligence such as "Revenue by Regions" or "Revenue by States". They do not work with zip codes or geocoded (latitude- & longitude-based) data.
Like all Logi data visualizations, map portions can be interactive links that can be clicked in order to "drill-down" to other reports, charts, and URLs.
These maps are based on Adobe's Flash technology and require that the free Flash Player browser-extension be installed in order for them to be viewed by consumers. Maps for 186 countries and regions are included with Logi Info; see the list of available maps below.
In almost all of these maps, their subdivisions (regions, provinces, states, etc.) are referenced by a internal numeric ID. In order to relate these ID numbers to "real world" names more likely to be encountered in your data, such as "Montana" or "Belgium", each map has a companion XML data file that can be used to cross-reference a region name to the internal ID. This is discussed in detail later in the Referencing Data section.
The Animated Map Element
Animated Maps are included in Logi Info applications by adding the Animated Map element to a report definition.
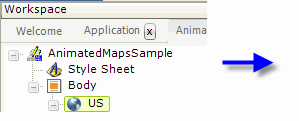
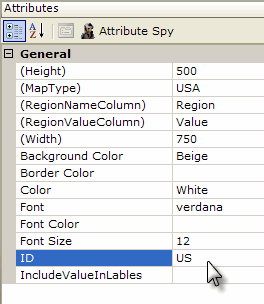
In the example above, an Animated Map element has been added and its attributes set as shown.
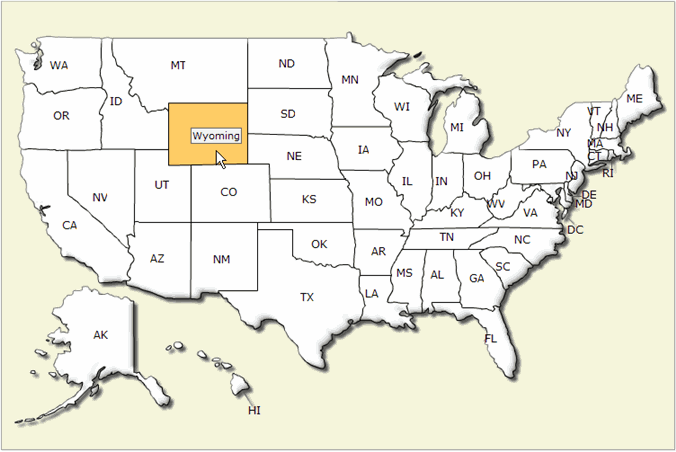
The resulting map is shown above. When the cursor passes over a state, its color changes and a "tooltip" appears with the full state name. The attributes for the Animated Map element are explained below. Unless otherwise noted, attribute values are optional.
| Attribute | Description |
|---|---|
| Height | (Required) The height of the map, in pixels. |
Map Type | (Required) The type of base map to be rendered; e.g. World, USA, China, USARegion etc. A complete list is provided at the end of this topic. Specific map type values can be found by examining the .swf files in the application folder's rdTemplate\rdFusionMap folder. The Arizona map, for example, is called FCMap_Arizona.swf and the file name portion "Arizona" is entered in this attribute. |
| Regional Name Column | (Required) The name of a column in the datalayer, with data representing the name/ID for each region inside a map. If a datalayer is not being used, enter an arbitrary placeholder value. |
| Regional Value Column | (Required) The name of a column in the datalayer, with data representing the value for each region to be mapped. If a datalayer is not being used, enter an arbitrary placeholder value. |
| Width | (Required) The width of the map, in pixels. |
| Background Color | The color of the map background; can be either a color name, a decimal RGB value, or a hex RGB value prefixed with a pound sign (#112233). "Transparent" is a valid value. |
| Border Color | The color of the map border lines, can be either a color name, a decimal RGB value, or a hex RGB value prefixed with a pound sign (#112233). "Transparent" is a valid value. |
| Color | The default color of the map; can be either a color name, a decimal RGB value, or a hex RGB value prefixed with a pound sign (#112233). "Transparent" is a valid value. |
| Font | The family name of font in the map. Can be followed by a space and "bold" or "italic". |
| Font Color | The color of the font in the map; can be either a color name, a decimal RGB value, or a hex RGB value prefixed with a pound sign (#112233). |
| Font Size | The size, in points, of the font in the map. |
| Hover Color | Sets the region's color when the mouse pointer is hovered over it; can be either a color name, a decimal RGB value, or a hex RGB value prefixed with a pound sign (#112233). |
| ID | The element's unique identifier. |
| Include Value in Labels | If working with a datalayer, set this value to 1 to have data values appear in the labels along with region identifiers. |
| Outer Border Color | The color of the outer border of the chart canvas; can be either a color name, a decimal RGB value, or a hex RGB value prefixed with a pound sign (#112233). |
| Show Labels | Set this to False if you do not want the labels to be displayed. Default: True |
Referencing Data
It's nice to be able to show maps, but the Animated Map element becomes really useful when it associates data with map regions. To do this, a datalayer element is added to the definition.
In the following example, a map of Canada will be produced, showing its provinces with their abbreviations. When the cursor passes over a province, a "tooltip" will appear showing the full province name and the number of members in a mythical book club chapter from that province.
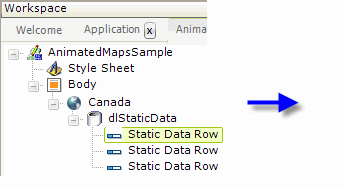
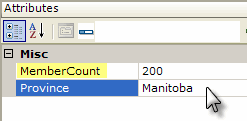
In the example definition above, a DataLayer.Static element has been added as a child of the Animated Map element, and some Static Data Row elements have been added to provide data values. Naturally, depending on the datasource, other types of datalayers can be used here.

A fragment of this map's companion XML data file, Canada.xml, is shown above. Note its highlighted attributes, "InternalID" and "LongName". In order to relate the Province value in our data to the appropriate region in the map, a datalayer Join can be used between the data and the companion XML file.
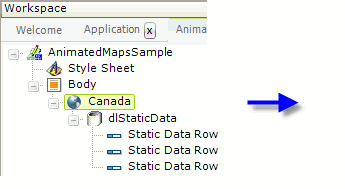
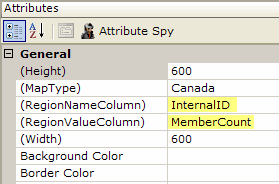
First, as shown above, the Animated Map element's Region Name Column attribute value is set to the InternalID in the companion XML file. The Regional Value Column attribute is set to the MemberCount value in the static data.
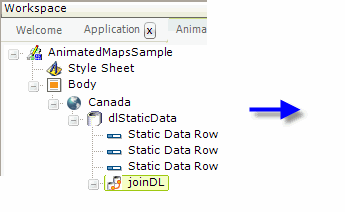
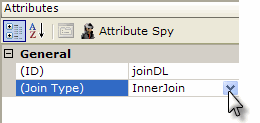
Next, a Join element is added, as shown above. The Join element performs the equivalent of a SQL JOIN on two datalayers. In this case, an Inner Join will used between the static datalayer and...
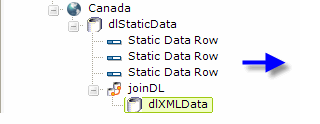
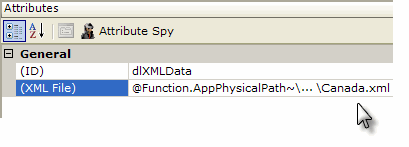
...a new DataLayer.XML File element which is added. This datalayer retrieves the data from the map's companion XML file and its XML File attribute value is shown but has been truncated to fit on this page. The real value should always begin with:
@Function.AppPhysicalPath~\rdTemplate\rdFusionMap\
and end with the name of the map's companion XML data file. The companion XML file names correspond to those of the map type .swf files (without the "FCMap_" prefix and with an .xml file extension). So, for example, the file FCMap_Canada.swf corresponds to the companion XML file Canada.xml.
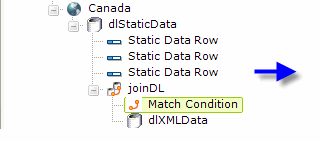
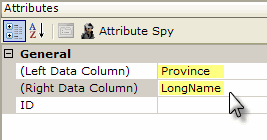
Finally, a Match Condition element is used to provide the JOIN criteria: the Province column value in the static datalayer must match the LongName column value in the companion XML file. Note that, as in any JOIN, the choice of which column is on the left and which is on the right is significant. Generally, the Left Data Column comes from the datalayer above the join and the Right Data Column from the datalayer below it.
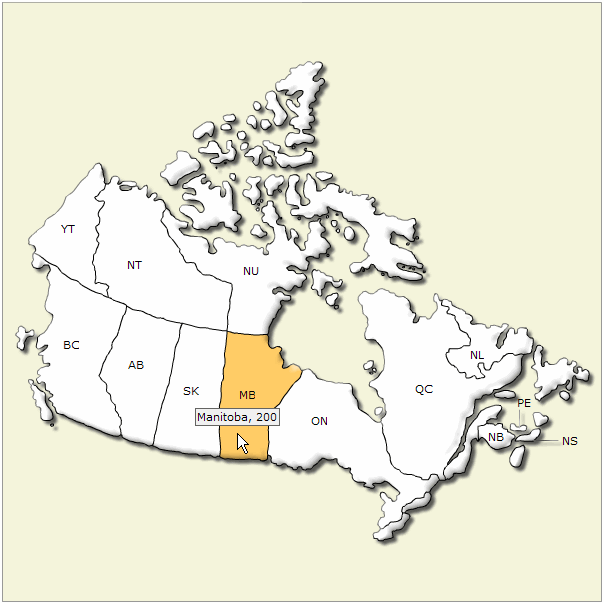
Now when the map is displayed, as shown above, and the cursor is placed over a region, the LongName and MemberCount information appear in a tooltip.
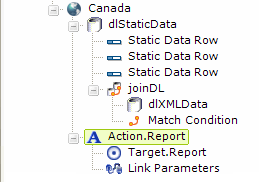
"Drill-down" capability can be added by placing an Action element, as shown above, beneath the Animated Map element. Region-specific data can be accessed using @Chart tokens and passed, as Link Parameters, to the next report or process.
Adding Color Ranges
Once data values have been associated with them, individual regions in an Animated Map can be color-coded based on those values.
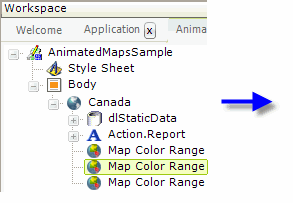
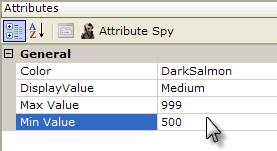
This is accomplished, as shown above, by adding one or more Map Color Range elements beneath the Animated Map element. Each element represents one color, which is set in its Color attribute. A legend is automatically generated for the map and the text in the DisplayValue attribute is used in it. The assignment of a color to a particular map region is controlled by the Max Value and Min Value attributes; the color will be assigned if the data value is within this range. These values correspond to the data value identified in the Animated Map element's Region Value Column attribute.
![]() Note this important distinction: in order to prevent overlapping ranges, the color is assigned if the data is equal to or greater than the Min Value attribute value, and less than the Max Value attribute value, and you need to provide your range values accordingly. For example,
Note this important distinction: in order to prevent overlapping ranges, the color is assigned if the data is equal to or greater than the Min Value attribute value, and less than the Max Value attribute value, and you need to provide your range values accordingly. For example,
| Data Values | Min Value | Max Value |
|---|---|---|
| 1 - 5 | 1 | 6 |
| 6 - 10 | 6 | 11 |
| 11 - n | 11 |
will accurately handle a data value of 10.5
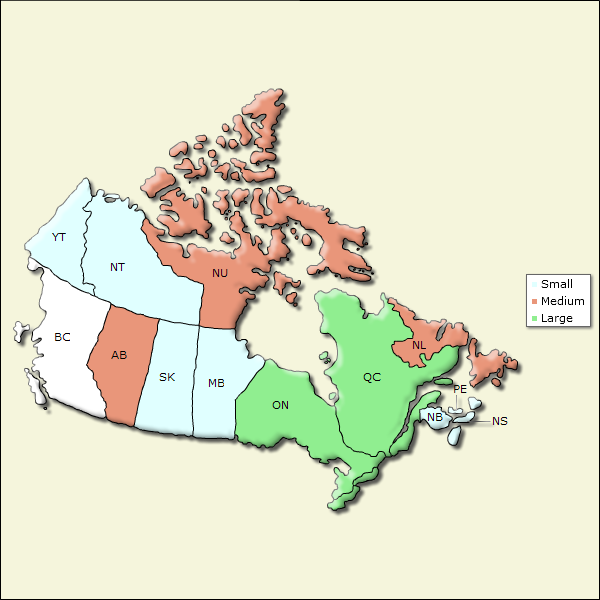
And the results can be seen in the example shown above. If no text is entered in the Display Value attributes, the numeric minimum and maximum values will be displayed in the legend instead.
Use a Color Spectrum Legend
Instead of using Map Color Range elements, you can add a "color spectrum" legend to your animated map; this legend uses colors to illustrate the distribution of the data values used to generate the map and assigns those colors to the appropriate map regions.
![]() Only one Color Spectrum Legend may be used per report definition (including its sub-reports), so this is not a viable option if you plan to show animated maps in, for example, tabs or dashboards. This limitation will likely be removed in future product releases, at which time this topic will be updated.
Only one Color Spectrum Legend may be used per report definition (including its sub-reports), so this is not a viable option if you plan to show animated maps in, for example, tabs or dashboards. This limitation will likely be removed in future product releases, at which time this topic will be updated.

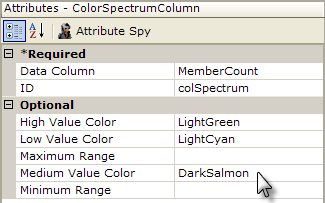
The first step, as shown above, is to add a Color Spectrum Column element beneath the datalayer. Configure its attributes to identify the data column used as the Animated Map element's Region Value Column, and the desired colors for the low, medium, and high values.

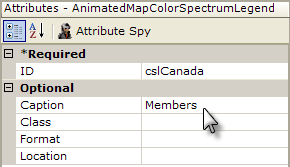
The next step is to add an Animated Map Color Spectrum Legend element, as shown above, beneath the Animated Map and to set its caption. The legend appears by default below the map, but its Location attribute can be set to make it appear to the right of the map.
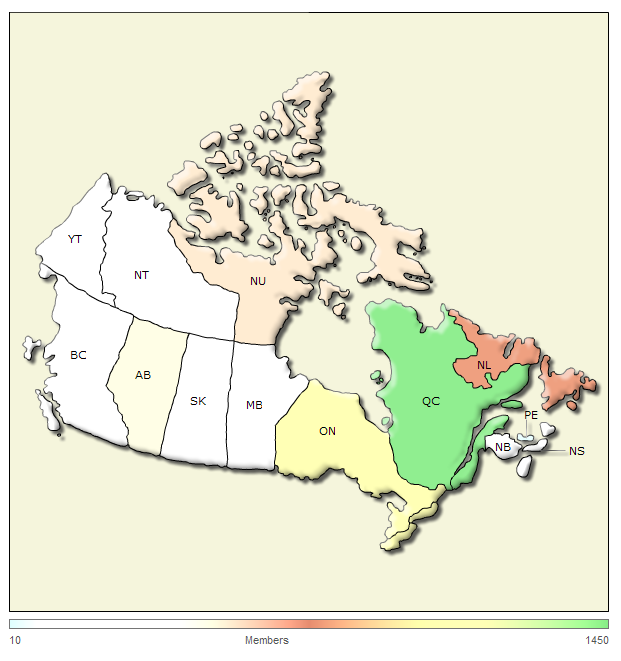
And the resulting map and legend are shown above.
Available Maps
The following maps are provided with Logi Info:
| Map Type | Description |
|---|---|
World | The World, with six major regions: North and Central America, South America, Europe, Africa, Asia, and Australia |
World8 | The World, with eight major regions: North America, Central America, South America, Europe, Africa, Middle East, Asia, and Oceana |
NorthAmerica | Includes Canada, United States, Mexico, Central America, and Caribbean Islands |
NorthAmerica_WOCentral | Includes Canada, United States, and Mexico |
| SouthAmerica | South America |
| CentralAmerica | Central America |
CentralAmericawithCaribbean | Central America, with Caribbean Islands |
Europe | Europe, with 46 countries |
EuropewithCountries | Europe, with 49 countries (adds England, Northern Ireland, and Wales) |
EuropeRegion | Europe, with five major regions: Western, Central, Eastern, Northen, Southern |
EastEuropeanRegion | Includes Bulgaria, Romania, Moldova, Ukraine, Belarus, and Russia |
CentralEuropeanRegion | Includes Switzerland, Germany, Liechtenstein, Slovenia, Austria, Czech Republic, Hungary, Slovakia, and Poland |
WestEuropeanRegion | Includes France, Monaco, Luxembourg, Belgium, and the Netherlands |
| NorthEuropeanRegion | Includes Iceland, Ireland, UK, Denmark, Norway, Sweden, |
| SouthEuropeanRegion | Includes Portugal, Spain, Andorra, Italy, San Marino, Vatican City, Malta, Croatia, Bosnia, Montenegro, Albania, Greece, Macedonia, Serbia, Turkey, and Cyprus |
| Asia | Asia, including Iran, Pakistan, Afghanistan, Turkmenistan, Uzbekistan, Kyrgyzstan, and Tajikistan |
| Asia3 | Asia, without the Middle-East countries in the previous map |
| Africa | Africa |
| MiddleEast | Middle East, including Saudi Arabia, Israel, Turkey, Syria, Iraq, Qatar, Oman, Yemen, Kuwait, Bahrain, Emirates, and countries listed as included in Asia map |
| Oceania | Australia, New Zealand, and nearby Pacific islands |
| USA | United States, including individual states |
| USARegion | United States, with five regions: Northwest, Southwest, Central, Northeast, Southeast |
USANorthWestRegion | Northwest states, including Alaska, Washington, Oregon, Idaho, Montana, and Wyoming |
USASouthWestRegion | Southwest states, including Hawaii, California, Nevada, Utah, Arizona, Colorado, and New Mexico |
USACentralRegion | Central states, including North and South Dakota, Nebraska, Kansas, Oklahoma, Texas, Minnesota, Iowa. Missouri, western Michigan, Wisconsin, and Illinois |
USANorthEastRegion | Northeast states, including eastern Michigan, Indiana, Ohio, Kentucky, Virginia, West Virginia, Pennsylvania, Maryland, Delaware, New Jersey, New York, Connecticut, Rhode Island, Massachusetts, Vermont, New Hampshire, and Maine, and the District of Columbia |
USASouthEastRegion | Southeast states, including Arkansas, Louisiana, Mississippi, Tennessee, Alabama, Georgia, Florida, South Carolina, and North Carolina |
(Individual States) | Map Type value is the state name, without any spaces; maps show counties |
| Canada | Canada, including thirteen provinces: Yukon Territory, British Columbia, Northwest Territories, Alberta, Saskatchewan, Nunavut, Manitoba, Ontario, Quebec, Newfoundland & Labrador, New Brunswick, Nova Scotia, and Prince Edward Island |
| (Provinces) | Maps provide counties. Map Type value is Ontario or Quebec. |
UK | United Kingdom, including England, Wales, Northern Ireland, and Scotland |
| (UK Countries) | Map Type value is one of four country names listed above, maps show counties |
| EnglandRegion | England, with nine regions: Southwest, Southeast, London, East, East Midlands, West Midlands, Northwest, Yorkshire & the Humber, and Northeast |
ScotlandRegion | Scotland, with ten regions: Dumfries & Galloway, Borders, Strathclyde, Lothian, Central, Fife, Tayside, Grampian, Highland, and Western Isles |
| (Countries) | These maps provide counties or other regional divisions. The Map Type values are: Afghanistan, Albania, Andorra, Antigua, Argentina, Armenia, AsiaGeorgia, Australia, Austria, Azerbaijan, Bahamas, Bahrain, Bangladesh, Belarus, Belgium, Belize, Bolivia, BosniaHerzegovina, Brazil, BritishColumbia, Bulgaria, Chile, China, Columbia, CostaRica, Croatia, Cuba, Cyprus, CzechRepublic, Denmark, Dominica, DominicanRepublic, Ecuador, Egypt, ElSalvador, Estonia, Finland, France, Germany, Greece, Greenland,
Grenada, Guatemala, Haiti, Honduras, Hungary, Iceland, India, Indonesia, Iraq, Ireland, Israel, Italy, Jamaica, Japan, Kenya, Latvia, Liechtenstein, Lithuania, Luxembourg, Malaysia, Malta, Mexico, Moldova, Montenegro, Mozambique, Netherland, NewZealand, Nicaragua, NorthIreland, NorthKorea, Norway, Paraguay, Peru, Poland, PuertoRico, Romania, Russia, SaintLucia, SaintKitssandNevia, SaintVincentandtheGrenadines, SanMarino, Saudia Arabia, Slovakia, Slovenia, SouthAfrica, SouthKorea, Spain, Suriname, Sweden, Switzerland,
Taiwan,
Thailand, Turkey, UAE, Ukraine, Uruguay, and Venezuela. |
| (Special Maps) | These maps provide regions or provinces: NorwayRegion, SpainProvinces |
Sample Application
A sample application can be found in the DevNet Sample Applications page.