Hierarchical Data
Data in hierarchical groups presents a special challenge for the Logi developer and this topic introduces several different techniques for presenting it using data tables.
- What is Hierarchical Data?
- Use Group Header and Group Summary Rows
- Create a Hierarchical Data Table with Indented Groups
- Create Hierarchies by Hiding Duplicate Values
- Work with Subdata Tables
See the Grouping Data sample application for examples related to this subject.
What is Hierarchical Data?
Hierarchical data is data that is grouped into a tree-like structure, with repeating parent/child relationships:
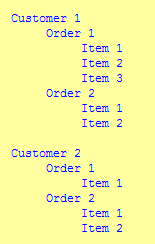
For example, the data shown above is in a hierarchy, grouped first by Customer, then by Order, with Order Item details. In the business intelligence reporting world, this is a very common approach to presenting data and segments the data visually in a way that makes it easy to understand.
The challenge with HTML-based reports, such as Logi applications, is to manage the screen real estate effectively and there are several approaches to doing this. Depending on the number of columns to be displayed, a straight forward data table can be used. If that isn't practical, then it may be better to embed a data table (a "subdata" table) within a table to more easily manage the columns; this is discussed in a later section. And, finally, placing a subdata table within a More
Info Row (see Data Table Rows) may help
to reduce visual clutter. The following examples build on the first approach, which uses a regular data table.
With User Input Elements
Some applications display data in a Data Table and include user input elements in each row of the table. A common example is a "Delete" checkbox for every record. This can be done in Logi applications, but is not recommended when hierarchical data is being used. The complex data relationships involved make it impossible to uniquely identify the associated user input elements.
This prohibition applies to obvious hierarchical representations, such as the Data Table, and also to elements like the Data Tree, which use hierarchical grouping internally to create their parent-child data representations.
Use Group Header and Group Summary Rows
One effective but uncomplicated method of displaying hierarchical data in a data table is to use Group Header and Group Summary Rows. As is often the case, the first step is to understand the data and what groupings are required.
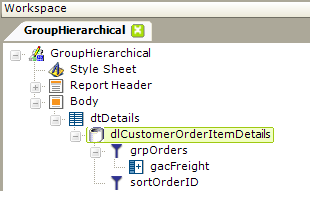
The example above shows a report definition in which a SQL query has been used to retrieve data from a JOIN of Customer, Orders, OrderDetails, and Products tables. A Group Filter element is used to create a hierarchical arrangement of the data, based on Order ID. A Group Aggregate Column element is used to create grouped totals of the Freight column, and a Sort Filter element is used to sort it all by Order ID.
Group filters create data groups by looking for unique values in a particular column. By default, the first row with a unique value is kept and the duplicate rows are discarded. Developers must choose to keep all grouped rows when building and presenting hierarchical data within a data table by setting the Group Filter element's Keep Grouped Rows attribute value to True.
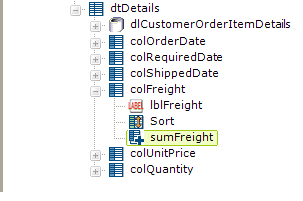
The next step, as a shown above, is to add Data Table Column elements for the detail data that we want to see. Each of these columns has Label and Sort child elements within them. In order to summarize the Freight costs, also add a Summary element to the definition beneath the Freight column. This element's attributes are then set to Sum the Freight column values.
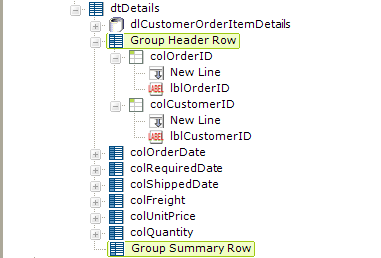
Finally, add Group Header Row and Group Summary Row elements, as shown above.
The Group Header Row requires some configuration: add Column Cell elements with New Line and Label child elements as shown. Set the Group Header Row element's Group Filter ID attribute value to the ID of the Group Filter added earlier ("grpOrders") and set the second Column Cell element's Column Span attribute to 5, as there are six total columns.
The Group Summary Row element will automatically use the Summary element added earlier ("sumFreight") and you only need to set its Caption attribute to something like Total:.
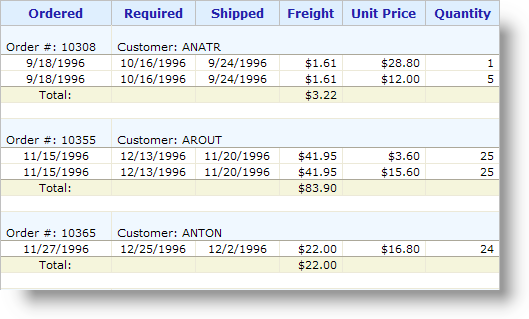
and the resulting report output is shown above. Note how the data has been arranged in a hierarchy. Style classes have been used to give different background colors to different types of rows.
When printing reports directly from the browser or from a PDF export, developers can choose to print each data grouping on separate pages. Set the Group Header Row or Group Summary Row element's Printer Page Break attribute to True to insert a page break before each group header row.
Create a Hierarchical Data Table with Indented Groups
The next example products a report that indents the data based on its hierarchical grouping. Once again, the first step is to understand the data and what groupings are required.
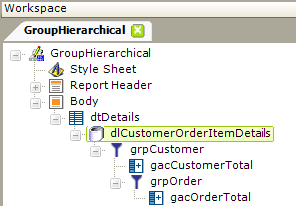
The example above shows a report definition in which a SQL query has been used to retrieve data from a JOIN of Customer, Orders, OrderDetails, and Products tables. Group Filter elements are used to create a hierarchical arrangement of the data, first by Customer, and then by Order. Group Aggregate Column elements are used to create group totals. Once again, we want to keep all of the group rows, by setting the Group Filter element's Keep Grouped Rows attribute value to True.
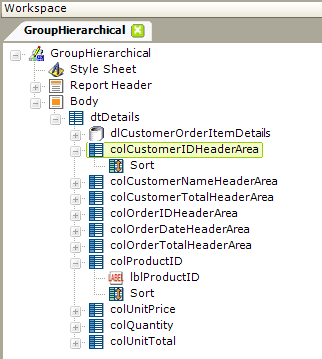
The next step, as shown above, is to provide columns for the data by adding Data Table Column elements to the definition. The highest level, Customer data, is being summarized using a Group Aggregate Column, so we will add columns to the definition that are really placeholders (they end in the example in "Area"). Similarly, we'll create placeholder columns for the Order data. These columns will not have any Label elements within them; their data will be displayed using a different mechanism described later.
The last four columns represent the lowest level of detail in the report, the Order Details, and we'll add columns for them, along with Label elements using @Data tokens to display the data and Sort elements.
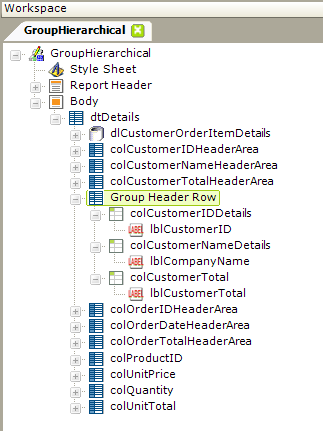
To provide data at the Customer level, a Group Header Row element is used, as shown above. Its Group Filter ID attribute value is set to the ID of the relevant group filter ("grpCustomer"). Beneath the header row, Column Cell and Label elements are added to provide the data in the first three columns of the report.
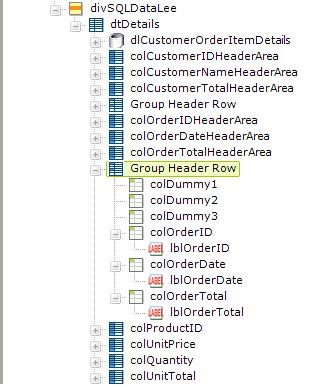
The process is repeated for the Order data, by adding another Group Header Row element, as shown above. However, this time three "dummy" Column Cell elements must be added to account for the columns holding the Customer data.
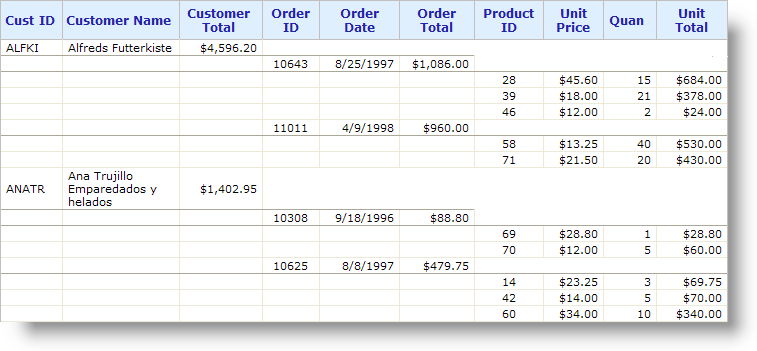
The resulting report looks like the example above. Group Summary Row elements could be used instead of, or in addition to, the Group Header Row, in order to place the summarized Order data beneath the Order Details.
Create Hierarchies by Hiding Duplicate Values
Another way to achieve something like the previous section's results is to use the Hide Duplicates element to create a hierarchical layout within a data table from one or more data groups. The Hide Duplicates element can be added beneath any Data Table Column to suppress output when the record in the current row is equal to the record from the previous row. By utilizing the Hide Duplicates element in several columns, developers can achieve the effect of a hierarchical table.
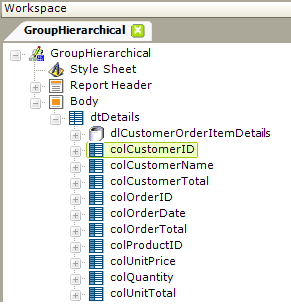
This example starts with the same datalayer used in the previous example, but there's just one Data Table Column element for each report column, as shown above. There are no Group Header Row or Group Summary Row elements.
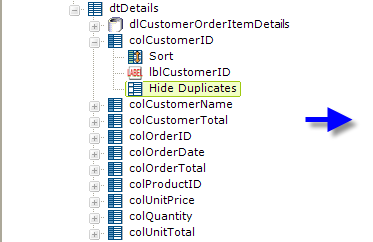
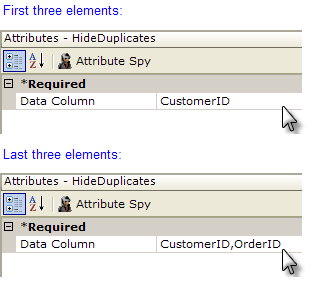
Beneath each of the first six Data Table Column elements, add a Hide Duplicates element. This element has one attribute, Data Column, which is the name of the column to check for duplicate values. In the first three columns, set this value to "CustomerID". In the second three columns, set this to a comma-separated list "CustomerID,OrderID", as shown above.
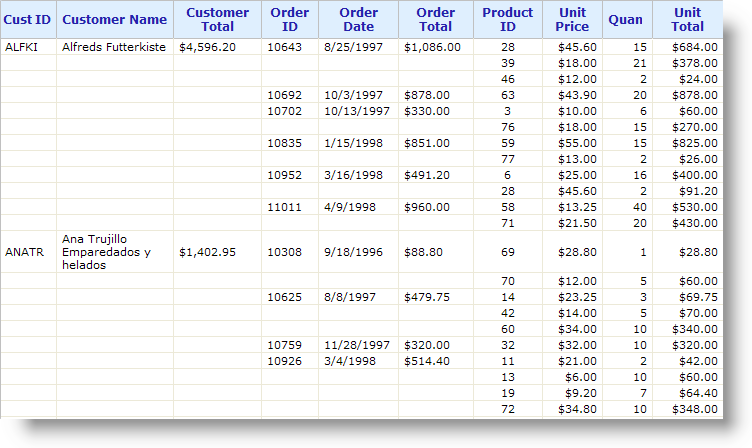
and the resulting report shows how the data is grouped and indented by virtue of suppressing duplicate data.
Working with Subdata Tables
As mentioned earlier, another method of presenting hierarchical data is to use a subdata table beneath a Data Table Column or More Info Row element, see Data Table Rows. Subdata tables receive data from the Subdata Layer element, which uses a standard datalayer to retrieve data and then relates its columns to those of the parent data table's datalayer.
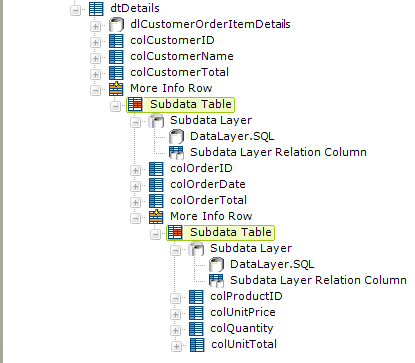
The example definition shown above employs two More Info Row elements and two Subdata Table elements to create a hierarchy of data. In this case, the detail data may not always be visible in the report and may require the user to do some clicking to make it visible.
For information about using subdata tables, see Subdata Tables.