Adding Interactive Features
There are several ways to customize your map to make it more interactive. First, ensure that you change the Compare Filter element's attributes to get data for Chicago only (Data Column = City, Compare Value = Chicago).
Put Controls on the Map
You can make your map more interactive by adding user controls to it:
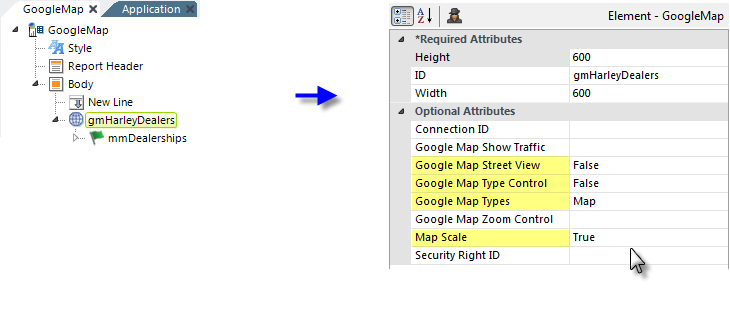
Revisit your Google Map element and set its Google Map Street View, Google Map Type Control, Google Map Types, and Map Scale attributes, as shown above.
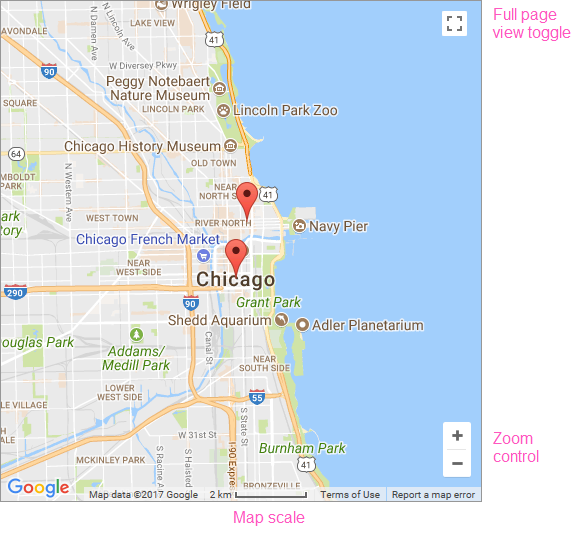
Save and browse your application. The map should now include Zoom controls and a Scale legend, as shown above.Try out the Zoom controls - they're actually a lot of fun to use!
Switch Between Map Types
The Google Map has other map types available including: a terrain map, a satellite image, and a hybrid combination of the satellite image overlaid with the street map. These can be selected at runtime by the user if you add the proper controls:
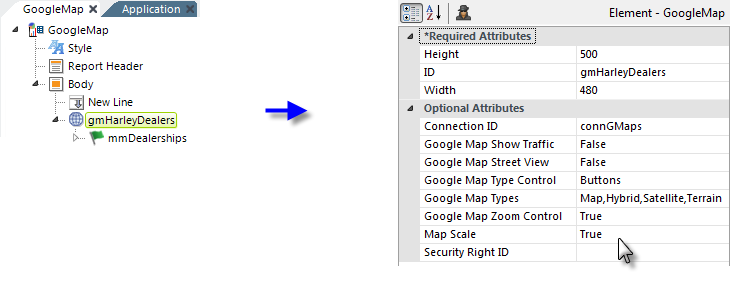
Go back to your Google Map element again and set its attribute as shown above.
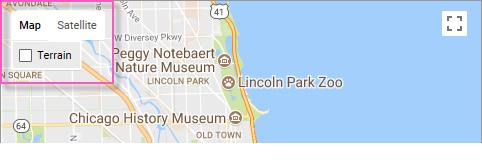
Save and browse your application. The map should now include the buttons shown above, which allow the user to switch between map types. Click the buttons and see what happens.
![]() Some of the map types are selected using check boxes that appear when you click a button.
Some of the map types are selected using check boxes that appear when you click a button.
Display a Custom Map Marker
The map of Harley-Davidson dealerships we created earlier can be enhanced by changing the graphic used to indicate locations on the map:
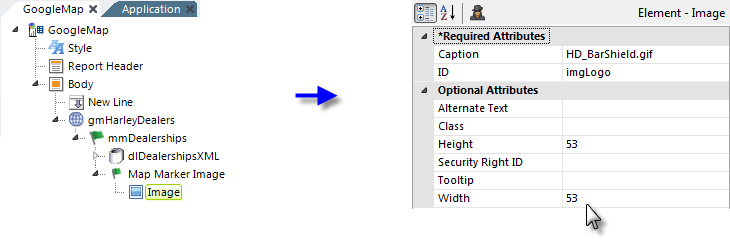
- In your definition, beneath the Google Map Markers element ("mmDealerships"), add a Map Marker Image element. This element has no attributes.
- Beneath it, add an Image element and set its attributes as shown. The image is from the data .zip file you downloaded earlier. A Height and Width attribute value is required when using an Image element in a Google Map.
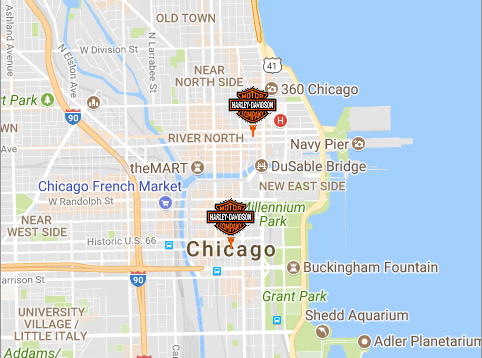
Save and browse your application, and see that the stock map marker has been replaced by the custom image, as shown above. Naturally, you have to exercise some caution when designing the size of alternate marker images so that you don't completely hide the map behind them.
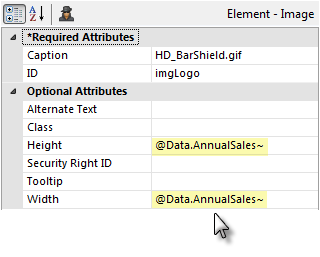
![]() Speaking of size, you can cause the marker image itself to convey relative data by setting its Height and Width attributes to some value from your database. In the example above, the token for a sales revenue data column (just an example here, it's not in the sample data) is used in the attribute values. The images on your map will then appear larger or smaller based on
the data, allowing
easy visual comparison.
Speaking of size, you can cause the marker image itself to convey relative data by setting its Height and Width attributes to some value from your database. In the example above, the token for a sales revenue data column (just an example here, it's not in the sample data) is used in the attribute values. The images on your map will then appear larger or smaller based on
the data, allowing
easy visual comparison.
Copyright © 2020 Logi Analytics, Inc. All Rights Reserved.