Previewing and Browsing
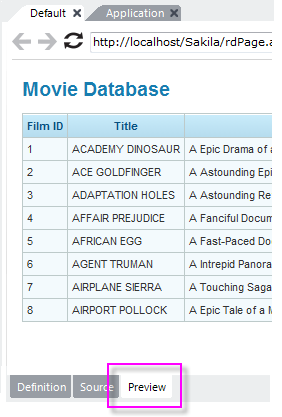
A Logi application may have one or more report definition files and, while actually browsing a report shows you the big picture, doing so can be cumbersome if you have multiple definitions. Studio's Preview tab provides the developer with a fast way to view the report definition currently being edited in the Workspace Panel, without changing the Default Report attribute in the _Settings definition.

To preview a Report definition:
- In the Application Panel, select and open the report definition to preview.
- Click the Preview button at the bottom of the Workspace Panel, as shown above.
- Browse and interact with the report definition using the toolbar at the top of the Preview panel.

Logi Info developers can also test their Process and Data definitions in a similar way:
- In the Application Panel, select and open the process definition to test.
- In the Test Parameters Panel, set values for any parameters the process task requires.
- At the bottom of the Workspace Panel, select the individual process task to test in the task list.
- Click the Run button at the bottom of the Workspace Panel, as shown above.
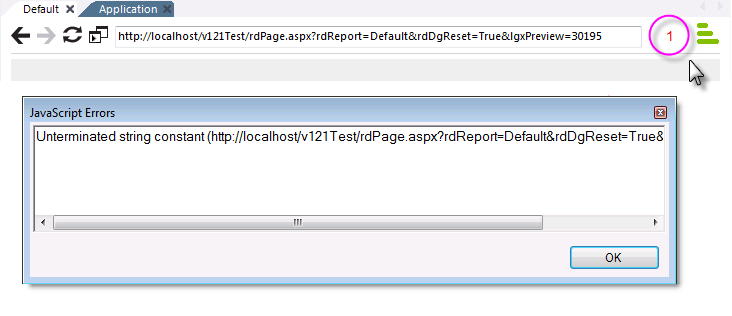
When using Preview, any JavaScript errors thrown will cause a count of the errors to appear next to the preview URL:

Click the number, as shown above, to display a dialog box containing the JavaScript error message. In earlier versions of Studio, the dialog box will simply be displayed automatically, interrupting execution.
Using Live Preview
The Live Preview feature allows you preview your work in a separate, "live" desktop window.

The Main Menu's Live Preview item is shown above. The live preview will be displayed in a separate window and any changes made to the definition will immediately be reflected in that window. You can resize and relocate the new preview window as desired; you can even drag it onto a separate display, if you have one.
You can also switch to Live Preview from regular Preview mode:

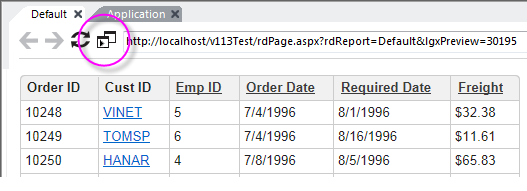
To start Live Preview, first preview the report definition, using the Preview tab, and then click the Live Preview icon, circled above.
The preview will be displayed in a separate window, and Studio will switch back to its Definition tab. You can resize and relocate the new preview window as desired; you can even drag it onto a separate display, if you have one.
Any subsequent changes you make to the definition code will immediately be reflected in the Live Preview window.

If you don't want definition changes to be updated immediately in the Live Preview window, you can pause and restart them, using the Pause and Play icons in the Live Preview window, circled above.
To exit Live Preview, just click the Live Preview window's Close (X) icon.
Browsing the Default Report Definition
In a Logi application, one of the report definitions is designated
(in the _Setting definition) as the "default" report - the page that
will be shown if no definition is specified in the URL. If you don't
change it, this is usually the Default report definition.

You can browse the default report by clicking the Run Application menu item, shown above, in Studio's Main Menu, or by pressing the F5 key. Your computer's default browser (the one associated with .htm/.html file extensions) will be used for this.
You can change the "default" report designation using two methods:

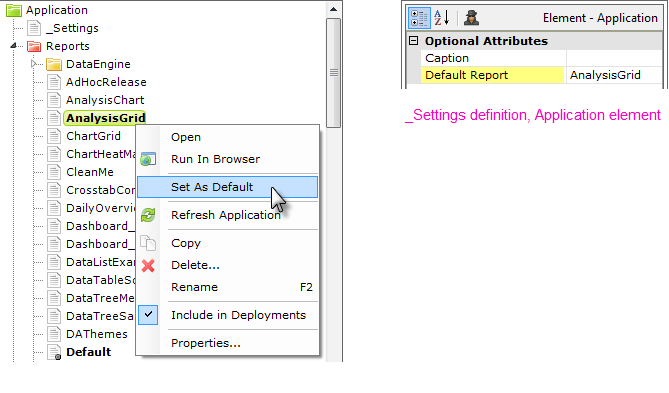
As shown above, left, in the Application panel, select the desired report definition, right-click it, and select Set As Default from its context menu. This sets the Application element's Default Report attribute, shown above, right, in the _Settings definition. You can also manually edit this attribute value directly in the _Settings definition.
Using the Run Application menu item will save all open, unsaved definitions before displaying the report.