Analysis Chart - Adding Forecasting
Forecasting features are included in the Analysis Chart. These features use a variety of techniques to produce projected values by analyzing existing values. Forecasting is available for Bar, Line, and Curved Line chart types.

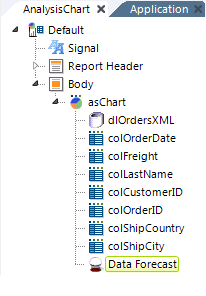
Forecasting is enabled in an Analysis Chart by including a Data Forecast element beneath it, as shown above. This element has no attributes.

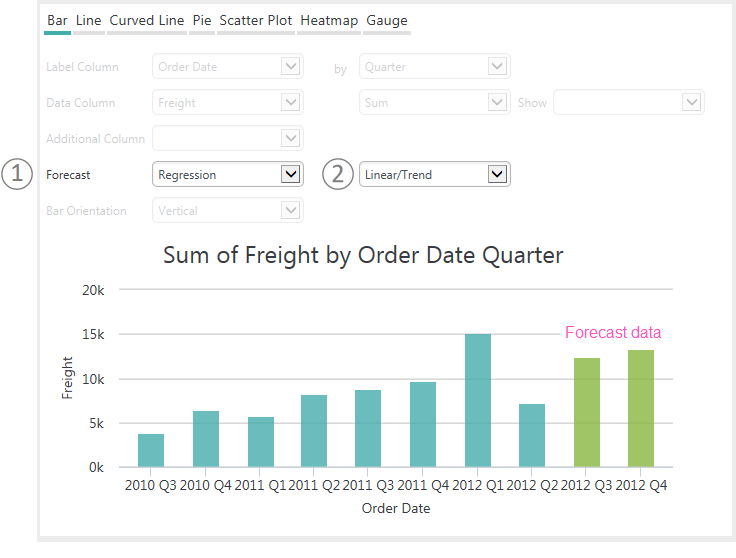
When the Data Forecast element is present and an appropriate X-axis column is selected, a special selection list (1) of forecast options will become visible in the control panel, as shown above. When an option is selected, the forecast data is displayed in the example chart as an extra set of bars. In other chart types, it might appear as a dotted line.
If the X-axis column is of DateTime type, the data may be analyzed using either Time Period Decomposition or Regression analysis; columns of Numeric type are analyzed using Regression analysis. An additional option list (2) allows selection of a time span for Time Period Decomposition analysis, or a regression method for Regression analysis. Available regression methods include:
- Linear/Trend
- Autoregressive (using "Burg's" formula)
- Exponential
- Logarithmic
- Polynomial (orders 2 - 5)
- Power
The forecast options also include Trend Line, with straight or curved presentation options.
he Studio wizard for creating an Analysis Chart also includes forecasting options. More information about forecasting is available in Forecast Methodologies.