Analysis Chart - Add Analysis Chart Columns
The columns available for use with an Analysis Chart consist of one or more columns from the datalayer.
Analysis Chart Columns have the following attributes:
| Attribute | Description |
|---|---|
Column Header | (Required) Specifies the text that will appear in the column header. |
Data Column | (Required) Specifies the name of the column in the datalayer that will appear in this column. |
Data Type | (Required) Specifies the type of data in this column: Boolean, Date, DateTime, Number, or Text. |
ID | (Required) Specifies a unique identifier for this element. |
Format | Specifies the formatting characteristics of the data. More information can be found in Format Data. |
No Aggregates | Set to True to prevent this column from being used as an aggregate column for charts. The user will not be able to pick the column from drop-down lists. |
No Compare | Set to True to prevent this column from being used as a comparison column. The user will not be able to pick the column from the drop-down list. In general, comparison columns should have a limited number of possible values, since each value appears in the chart legend. |
No Grouping | Set to True to prevent this column from being used as a grouping column when building charts, such as Bar, Pie and Heatmap charts. The user will not be able to pick the column from drop-down lists. |
Security Right ID | When using Logi Security, specifies one or more Security Right IDs, separated by commas. Users with these Security Right IDs will be able to view the column, users without them will not. |
Working with Analysis Chart columns is easy and here's how to add them:

- In Studio, select the parent Analysis Chart element and add the Analysis Chart Column element.
- Set the Column Header and ID attributes.
- Set the Data Column attribute to the name of a column returned by the datalayer. Tokens are not necessary here; just providing the column name is sufficient.
- Set the Data Type attribute to Text, Number, or Date.
![]() There is no way to make the appearance of an individual Analysis Chart Column conditional.
There is no way to make the appearance of an individual Analysis Chart Column conditional.

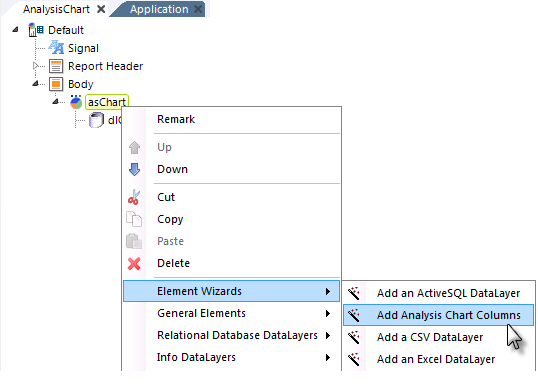
Studio includes a wizard to assist in adding Analysis Chart Columns. Select and right-click your Analysis Chart element, and use the context menus shown above to launch the wizard.

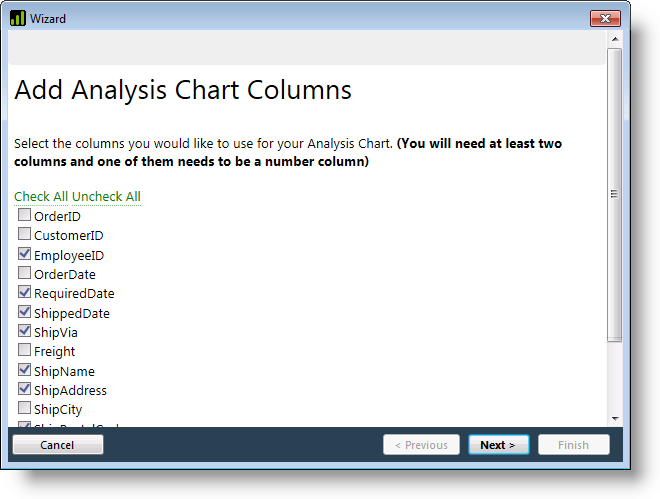
As shown above, the wizard lets you select the columns in the datalayer to use with the chart and to set their data types. The wizard can be launched by selecting the Analysis Chart element and then either clicking it in the main menu's Wizards tab or right-clicking and selecting it from the element's Element Wizards pop-up menu.