Format Paper
The Format Paper dialog helps you to format the paper of a chart. It contains the following tabs: General, Border, Coordinate, Threshold Line, Axis Z and Bullet (some tabs may be not applicable for certain chart types).
OK
Applies the settings and closes this dialog.
Cancel
Cancels the settings and closes this dialog.
Help
Displays the help document about this feature.
General
This tab shows some general information of the chart paper.
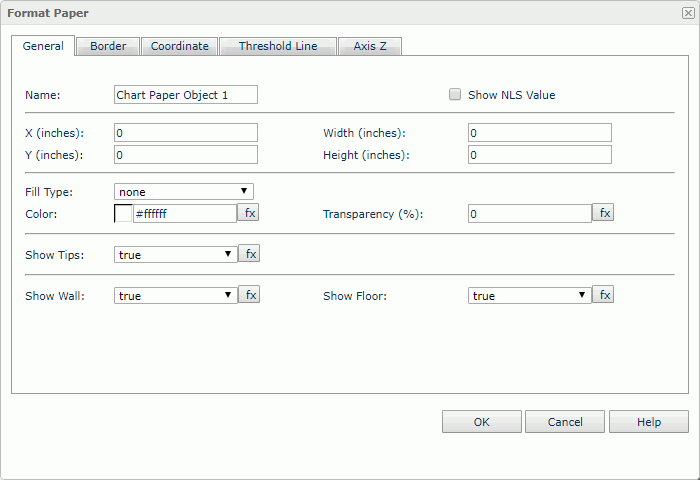
Name
Specifies the display name of the chart paper.
Show NLS Value
Specifies to show the translated name for the display name of the chart paper in the Name text box if you have enabled the NLS feature and translated it.
If checked, this option takes effect only when the display name of the chart paper is not modified.
X
Specifies the X coordinate of the chart paper.
Y
Specifies the Y coordinate of the chart paper.
Width
Specifies the width of the chart paper.
Height
Specifies the height of the chart paper.
Fill Type
Specifies the type for filling the chart paper.
Color
Indicates the background color of the chart paper.
To change the color, select the color indicator to access the Select Color dialog and then specify a new color, or input a color string in the format #RRGGBB. If you want to make the background transparent, input Transparent in the text box.
Transparency
Specifies the transparency of the chart paper background color.
Show Tips
Specifies whether to show the corresponding data information when the mouse pointer points at a target in the chart paper.
Show Wall
Specifies whether to show the chart wall.
Show Floor
Specifies whether to show the chart floor.
Border
This tab shows information about borders of the chart paper.
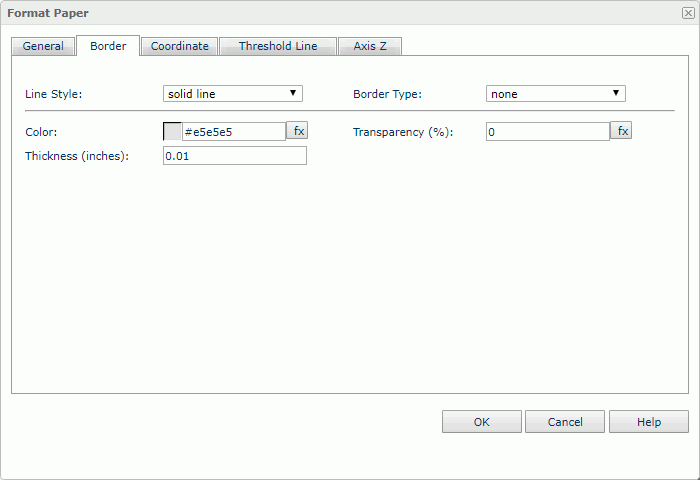
Line Style
Specifies the line style of the chart paper borders.
Border Type
Specifies the type of the chart paper borders.
Color
Specifies the color of the chart paper borders.
Transparency
Specifies the color transparency of the chart paper borders.
Thickness
Specifies the thickness of the chart paper borders.
Coordinate
You can use this tab to view and configure properties of the coordinates.
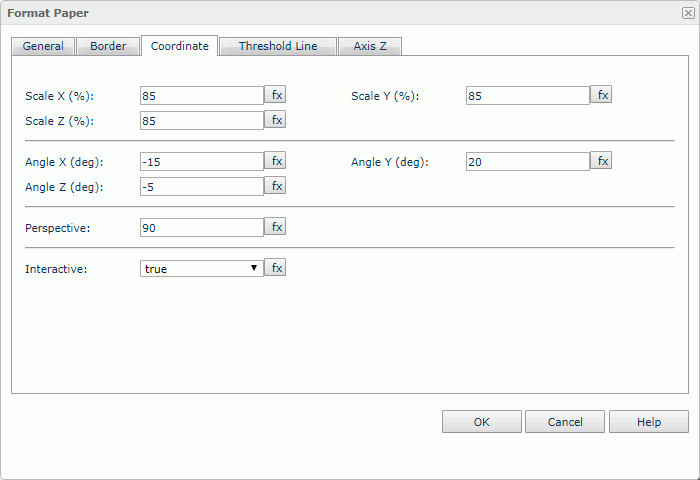
Scale X
Specifies the scaling ratio for the X axis.
Scale Y
Specifies the scaling ratio for the Y axis.
Scale Z
Specifies the scaling ratio for the Z axis.
Angle X
Specifies the rotation angle around the X axis. Applies to 3-D charts and pie charts.
Angle Y
Specifies the rotation angle around the Y axis. Applies to 3-D charts and pie charts.
Angle Z
Specifies the rotation angle around the Z axis. Applies to 3-D charts and pie charts.
Perspective
Specifies the perspective effect of the chart. Input an integer to set the effect.
Interactive
Specifies whether the chart can be interactive or not.
Threshold Line
You can use this tab to view and configure properties of the threshold lines.
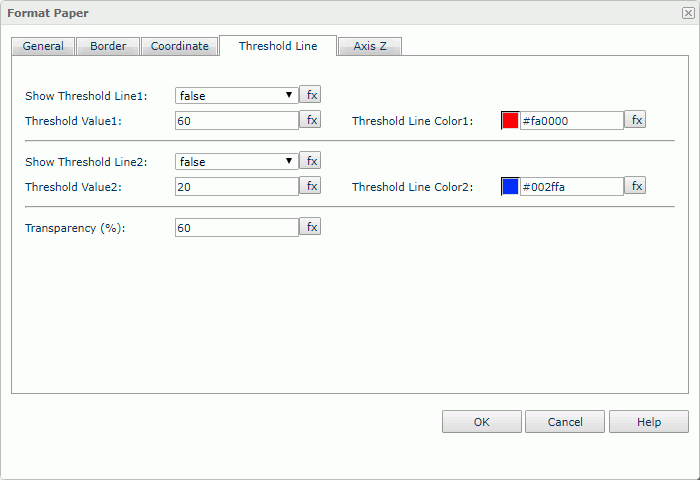
Show Threshold Line1
Specifies whether or not to show the first threshold line.
Threshold Value1
Specifies the value of the first threshold line.
Threshold Line Color1
Specifies the color of the first threshold line.
Show Threshold Line2
Specifies whether or not to show the second threshold line.
Threshold Value2
Specifies the value of the second threshold line.
Threshold Line Color2
Specifies the color of the second threshold line.
Transparency
Specifies the color transparency of the threshold lines.
Axis Z
You can use this tab to view and configure properties of the Z axis.
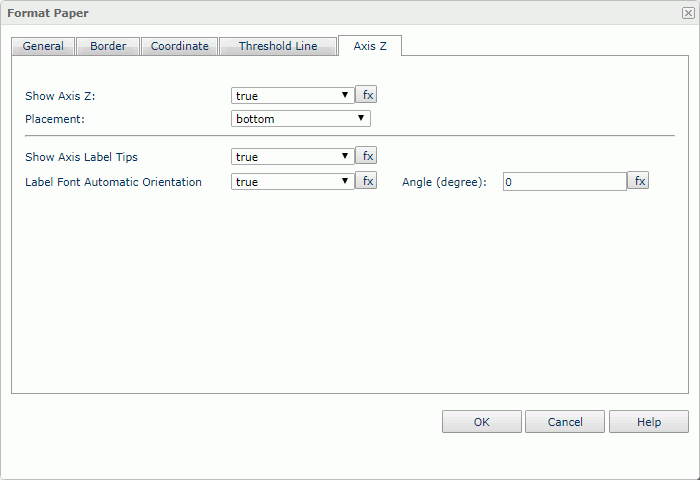
Show Axis Z
Specifies whether or not to show the Z axis.
Placement
Specifies the position of the axis.
Show Axis Label Tips
Specifies whether to display the complete label text when the mouser pointer points at a label on the axis.
Label Font Automatic Orientation
Specifies to adjust the rotation angle of the label text on the axis automatically according to the length of the label text, in degrees.
When this option is true by default:
- If the text can be completely displayed horizontally, the default rotation angle will be 0.
- If the text cannot be completely displayed horizontally, the default rotation angle will be 30 anticlockwise, and the cut off part will be shown as suspension points.
Angle
Specifies to customize the rotation angle of the label text on the axis. Activated when Label Font Automatic Orientation is set to false (unchecked). You can input the angle in the text box directly.
Bullet
You can use this tab to view and configure properties of the bullets in a chart.
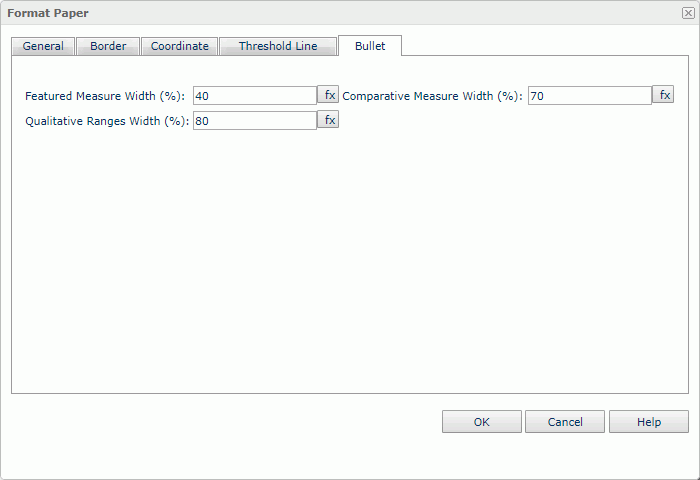
Featured Measure Width
Specifies the width of the featured measures, measured in a percentage of the unit width. Enter a numeric value to change the width.
Comparative Measure Width
Specifies the width of the comparative measures, measured in a percentage of the unit width. Enter a numeric value to change the width.
Qualitative Ranges Width
Specifies the width of the qualitative ranges, measured in a percentage of the unit width. Enter a numeric value to change the width.
 Previous Topic