Lesson 3: Creating and Performing Data Analysis on Page Reports
Using Page Report Wizard the user can create a single component page report which is viewed in Page Report Studio. Page Report Studio provides the user a page mode view of the report very similar to a printed report.
There are several types of reports in the Page Report Wizard which collect information for you: blank (no component), banded, crosstab, table, and chart. You can add components to or remove them from the report after it is generated by the wizard. In this lesson, we will create a page report that contains three report tabs, and then perform data analysis on them to look at the data in other ways.
Data analysis is a process of evaluating data using analytical/logical reasoning. In JReport, business view elements can be added to existing data components. Business views greatly enhance your ability to discover useful information, draw conclusions and support the decision making process.
This lesson contains the following tasks:
- Task 1: Create a Banded Report
- Task 2: Create a Table Report
- Task 3: Create a Crosstab Report
- Task 4: Insert a Chart
- Task 5: Analyze Data of a Banded Object
- Task 6: Analyze Data of a Table
- Task 7: Analyze Data of a Crosstab
- Task 8: Analyze Data of a Chart
Task 1: Create a Banded Report
- On the Logi JReport Server Start Page, select Page Reports in the Create category.
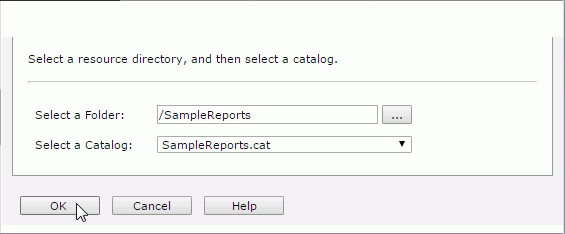
- In the displayed page, select the SampleReports folder and SampleReports.cat catalog file, then select OK.
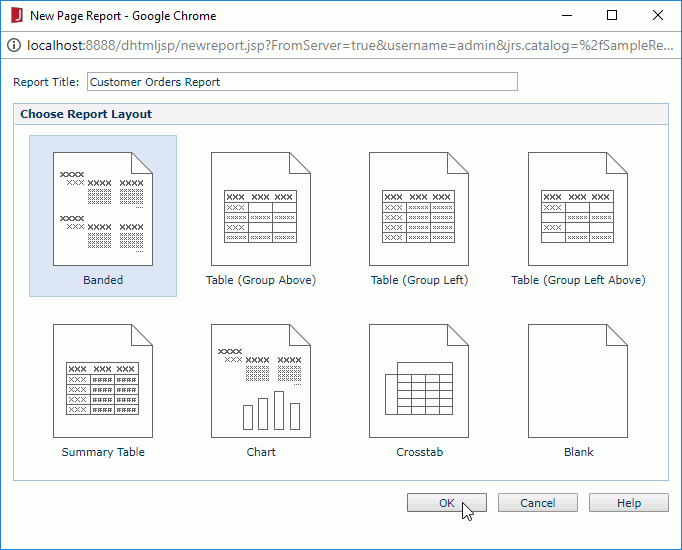
- In the New Page Report dialog, type Customer Orders Report in the Report Title text field, select Banded in the layout box, then select OK.
The Banded Wizard appears.
- In the Data screen, select WorldWideSalesBV in Data Source 1 from the Available Data Resources list.
Select Next.
A page layout ad hoc report is supported by only one business view. The definition of a business view determines what can be done on a report. Typically this information is communicated to the business analyst who builds the report.
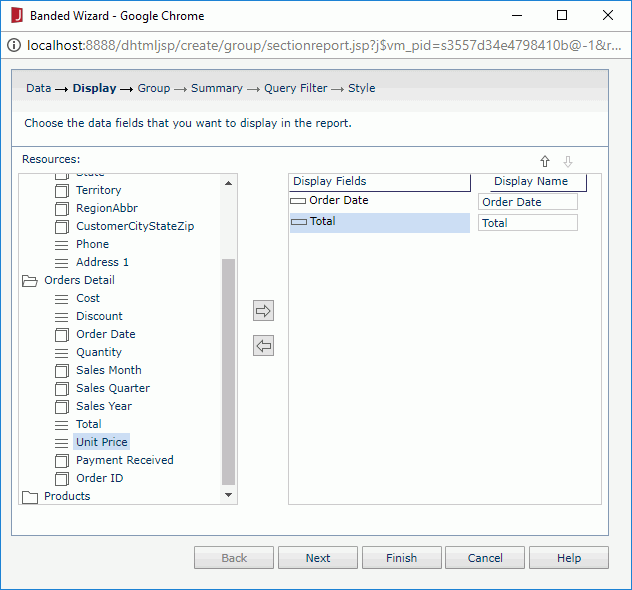
- In the Display screen, expand the Orders Detail category in the Resources box, add Order Date and Total in it as detail fields one by one by selecting
 . Select Next.
- In the Group screen, select Country in the Customers category and select
 to add it as a group by field, keep Ascend as the sort manner, and then select Next.
 - Skip the Summary screen and select Next, the same to the Query Filter screen.
- In the Style screen, set the style to ClassicBlue, and then select Finish to create the report.
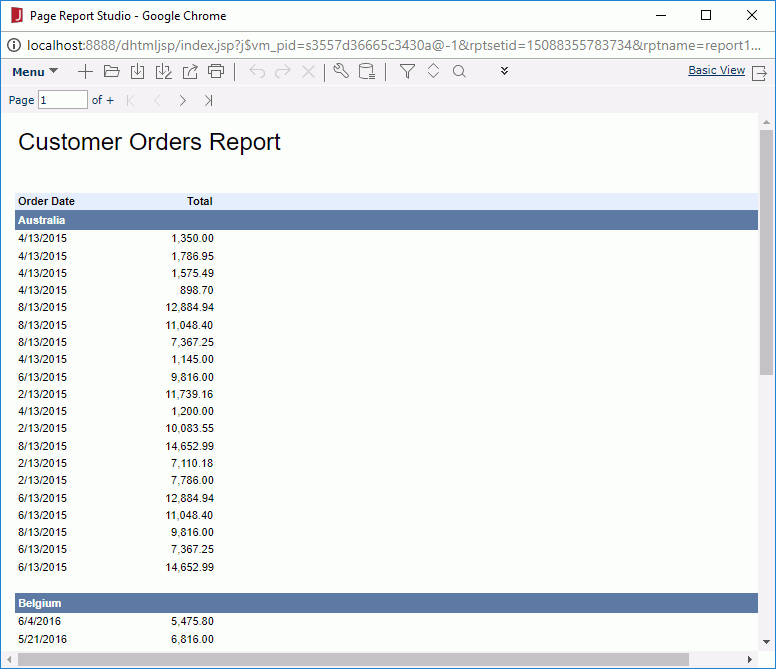
The report appears as follows in Page Report Studio:
- Select Menu > File > Rename Report Tab.
- In the Rename Report Tab dialog, enter CustomerOrders as the report tab name, then select OK.
- Select the Save button
 on the toolbar.
 - In the Save As dialog, type CustomerOrders.cls in the File Name text field, then select OK. In the Confirm dialog, select OK.
Task 2: Create a Table Report
- In the current open report window, select the New Report Tab button
 on the toolbar.
 - In the New Report Tab dialog, enter Current Customers in the Report Title text field, select Table (Group Above) in the layout box, then select OK. The Table Wizard appears.
- In the Data screen of the wizard, select WorldWideSalesBV in Data Source 1, then select Next.
- In the Display screen, add Customer Name, Phone and CustomerCityStateZip (change its display name to Zip) from the Customers category as the detail fields. Select Next.
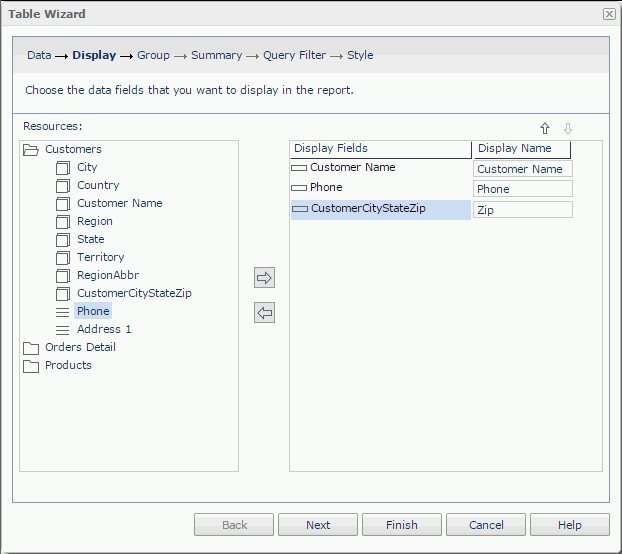
- In the Group screen, add Country from the Customers category as the group by field, keep Ascend as the sort manner, then select Next.
- Skip the Summary screen and select Next to access the Query Filter screen.
As we would like to focus on customers not in USA, we will apply a filter to the business view. However, we find that there is no predefined filter in the business view, so we will define one.
- In the Query Filter screen, define the filter as Country != 'USA', then select Next.
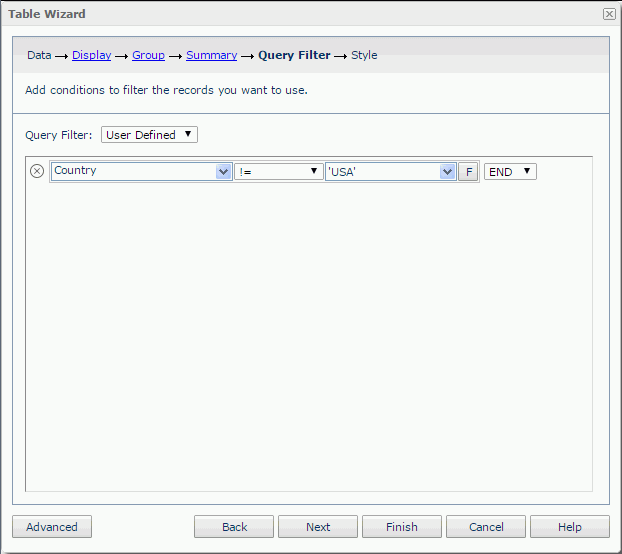
- In the Style screen, set the style to ClassicBlue, and then select Finish to create the table report.
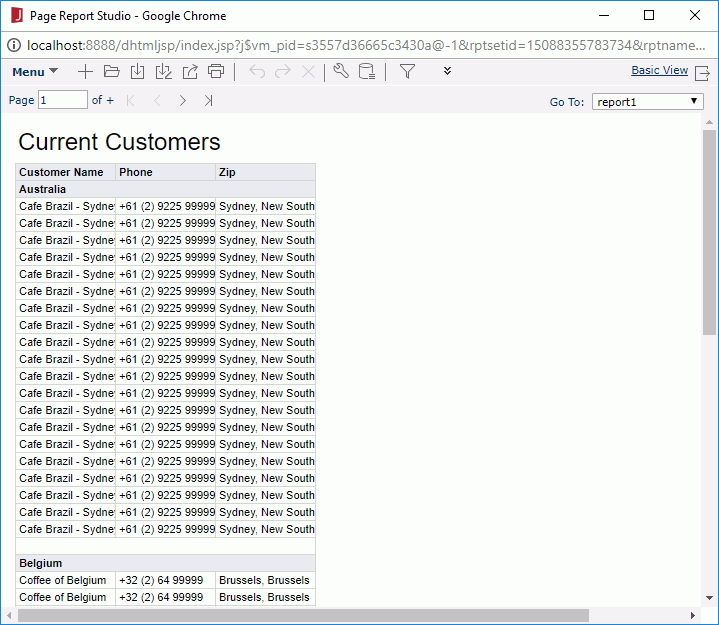
The table report appears as follows:
- Select Menu > File > Rename Report Tab. In the Rename Report Tab dialog, enter CurrentCustomers as the report tab name, then select OK.
- Select the Save button
 on the toolbar. In the Save Report Template dialog, select Yes to save the report, then select OK in the prompt message window.
Task 3: Create a Crosstab Report
- In the current open report window, select the New Report Tab button
 on the toolbar.
 - In the New Report Tab dialog, type Sales Report in the Report Title text field, select Crosstab in the layout box, then select OK. The Crosstab Wizard appears.
- In the Data screen, select WorldWideSalesBV in Data Source 1 and then select Next.
- In the Display screen, add Country from the Customers category in the Resources box as the row field and Category from the Products category as the column field (keep Ascend as the sort manner for both columns and rows), then add Total Sales from the Orders Detail category as the summary field. Select Next.
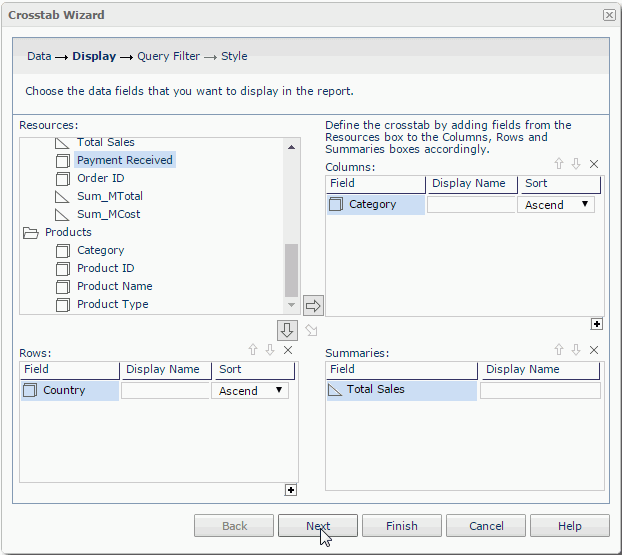
- Skip the Query Filter screen. Select Next.
- In the Style screen, set the crosstab style as ClassicBlue, then select Finish to create the crosstab report.
The crosstab report appears as follows:
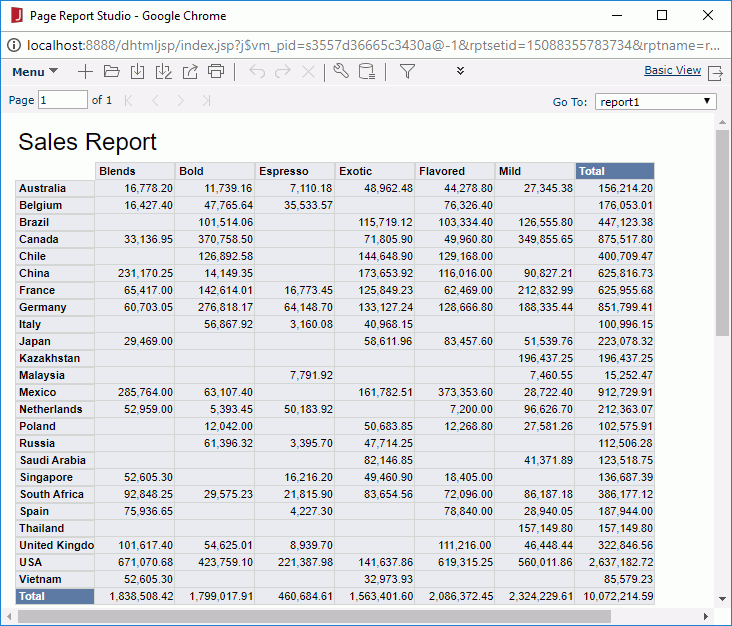
- Select Menu > File > Rename Report Tab. In the Rename Report Tab dialog, enter Sales as the report tab name, then select OK.
- Select the Save button
 on the toolbar. In the Save Report Template dialog, select Yes to save the report, then select OK in the prompt message window.
Task 4: Insert a Chart
In this task, we insert a chart into the Sales report created in Task 3.
- In the current report window, select Menu > View > Toolbox to display the Toolbox panel.
- Drag Chart to place it under the last row of the crosstab.
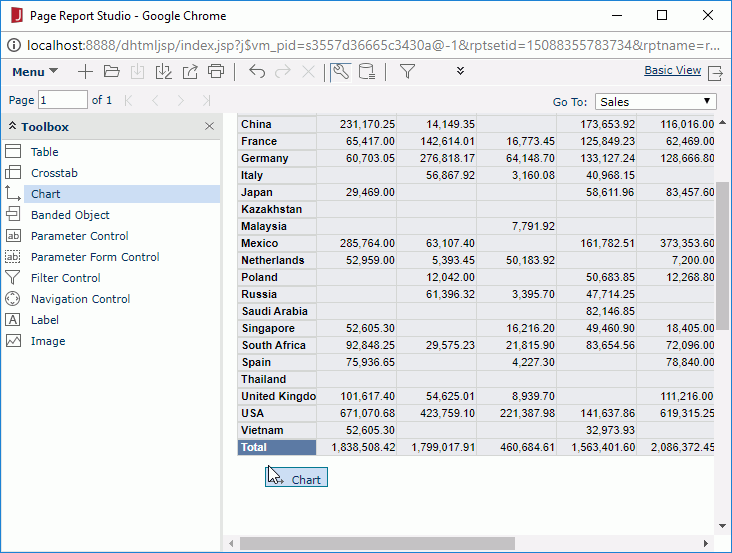
The Chart Wizard appears.
- In the Data screen, select WorldWideSalesBV in Data Source 1, then select Next.
- In the Type screen, keep the default chart type Clustered Bar 2-D and select Next.
- In the Display screen, add Sales Quarter from the Orders Detail category to the Category box and Product Type in the Products category to the Series box, then add Total Sales in the Orders Detail category to the Show Values box.
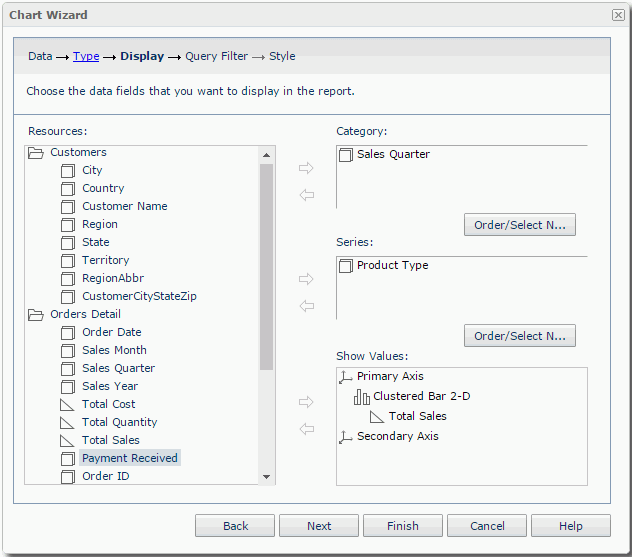
- Select Finish to create the chart. The chart appears as follows:
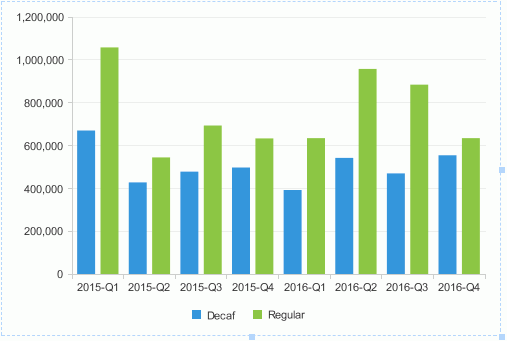
- Select the Save button
 on the toolbar. In the Save Report Template dialog, select Yes to save the report, then select OK in the prompt message window.
Task 5: Analyze Data of a Banded Object
- In the current report window, select CustomerOrders from the Go To drop-down list on the toolbar to switch to this report tab.

Now, we want to make the records in each Country group further grouped in product category, and to know the discount.
- On the left side, close the Toolbox panel by selecting X on the Toolbox title bar, then select Menu > View > Resource View to display the Resource View panel.
- In the panel, expand the Products category, drag Category to the banded object and drop it as the mouse pointer moves below the Country group header and a tip Group Header appears.
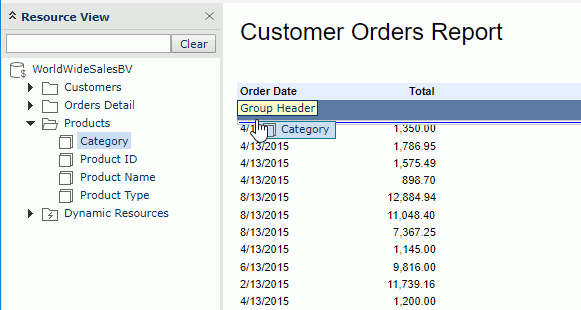
The report tab appears as follows:
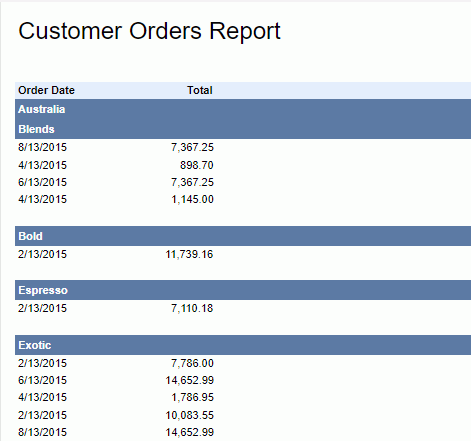
- Drag the Discount field in the Orders Detail category to the detail panel of the banded object:
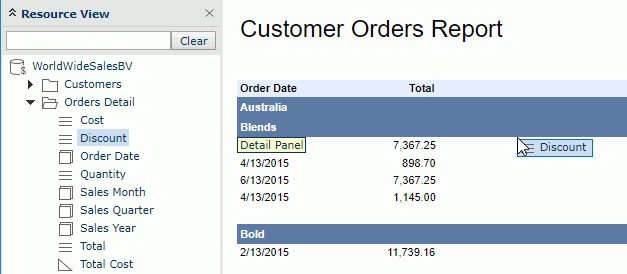
Now the report tab looks as follows:
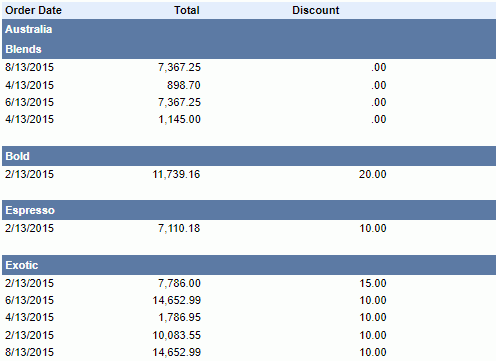
Next, we will do some adjustments to improve the appearance of the report tab.
- Right-click the label Customer Orders Report and select Properties from the shortcut menu. Then in the Label Properties dialog, go to the Font tab, check the Bold option and then select OK.
- Right-click any value of the Order Date field and select Properties from the shortcut menu.
- In the General tab of the Data Field Properties dialog, set the Format property to MM/dd/yyyy and select OK.
There are two group levels in the banded object, so we will change the background color of the Category group in order to distinguish the two levels.
- Right-click the group header panel of the Category group and select Properties on the shortcut menu.
- In the General tab of the Banded Panel Properties dialog, set the Background property to #668cb2, and then select OK to confirm.
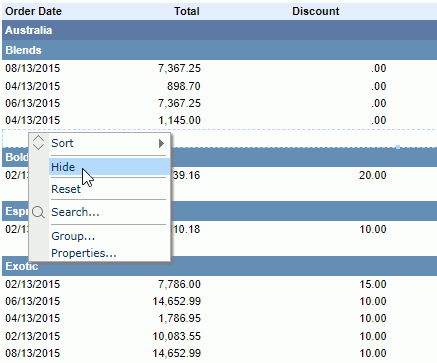
Select the Next button  on the toolbar (or just simply scroll down the mouse wheel) to navigate to the next page (page 2). Repeat this to navigate to the following pages. There is a large space or gap before each new Category begins. This is caused by a blank Group Footer panel at the end of each category. We will remove the Group Footer panel. Return to the first page.
- Right-click the footer panel of the Category group and select Hide from the shortcut menu.
- Now the report tab looks as follows:
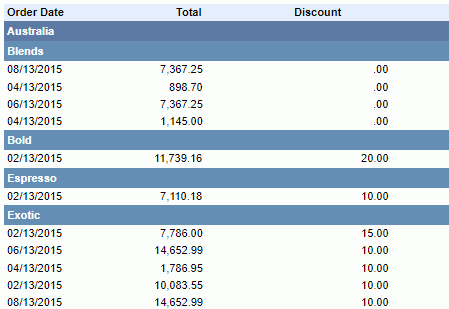
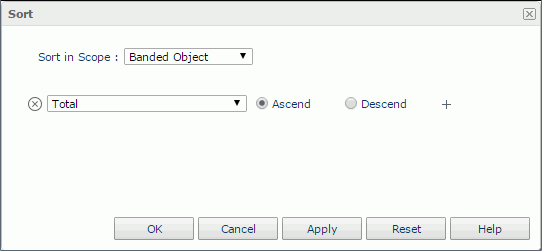
Next, we will sort and filter records. The totals will be sorted in ascending order for each group. The records will be filtered by discount. The report will only display orders in which the discount is 30.
- Select the Sort button
 on the toolbar to open the Sort dialog.
 - In the Sort dialog, choose Total from the field drop-down list, keep the sorting manner as Ascend, and then select OK to apply the settings.
- Right-click any value of the Discount field, and on the shortcut menu, select Filter > 30.00.
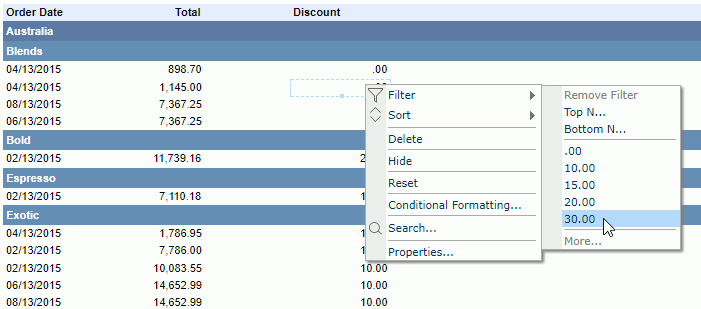
After doing the sorting and filtering, the report tab looks as follows:
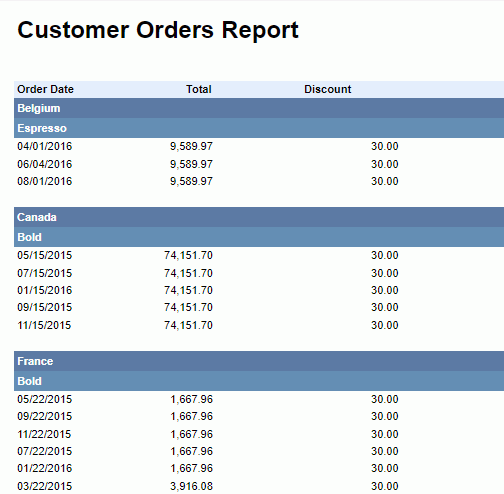
In the above two steps, we used two ways to sort and filter the report results: one by dialog and the other by right-click menu command. In fact, both sorting and filtering can be achieved by either way.
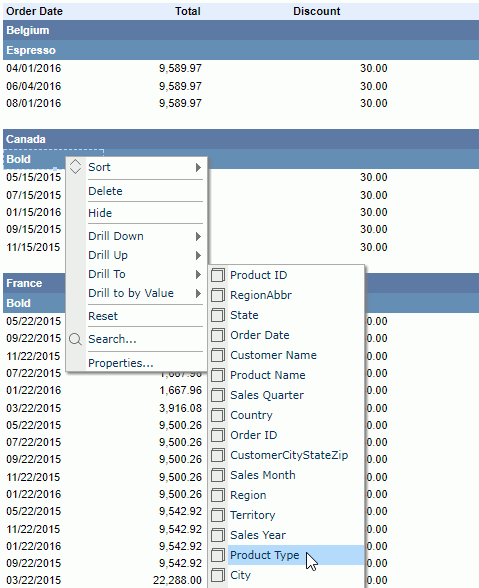
We have defined two grouping levels in the banded report: one by Country and the other by Category. Next, we will change one of the grouping criteria: grouping the banded object by Product Type instead of Category.
- Right-click any of the Category value ("Bold" for example) and select Drill To > Product Type on the shortcut menu.
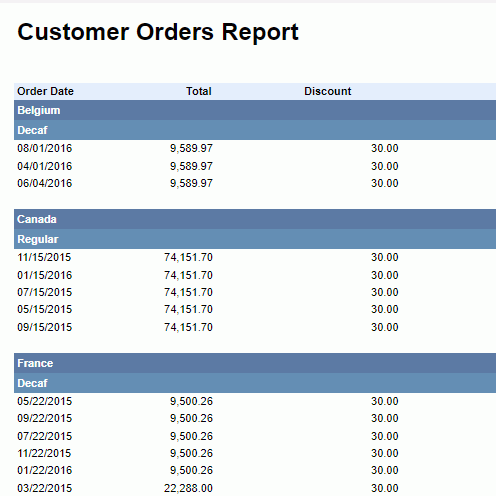
The report result finally changes to:
- Select the Save button
 on the toolbar. In the Save Report Template dialog, select Yes to save the report, then select OK in the prompt message window.
Task 6: Analyze Data of a Table
- Select CurrentCustomers from the Go To drop-down list on the toolbar to switch to this report tab.
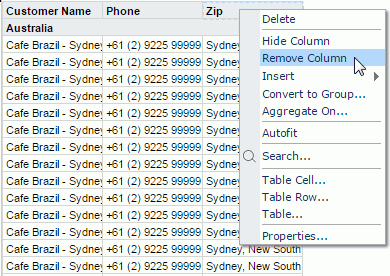
First, we want to remove the zip information from the table as we think it is not required.
- Right-click the Zip label and select Remove Column from the shortcut menu to delete the Zip label and its corresponding DBField.
Next, we will add a group Region, and make its level higher than the existing Country group.
- From the Resource View panel, drag Region from the Customers category to above the Country group header and drop it when a horizontal blue line appears above the Country group header.
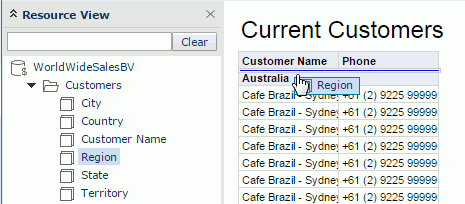
Next we want to add some detail fields to the table. We can do this either by dragging or using the dialog.
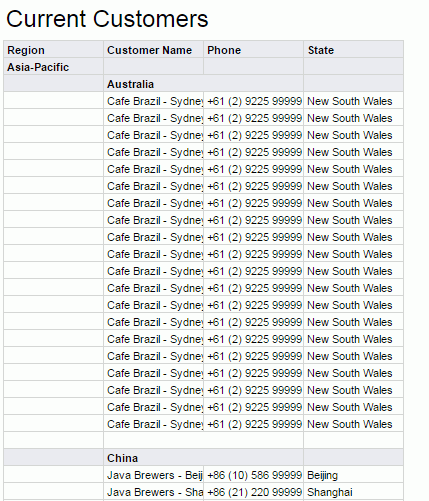
- Drag State from the Resource View panel to the top right boundary of the Phone column. Hover over the right boundary of the Phone table header and drop it when a vertical blue line appears to the right of Phone. This requires careful mouse movements and a steady hand. Select OK in the prompt message.
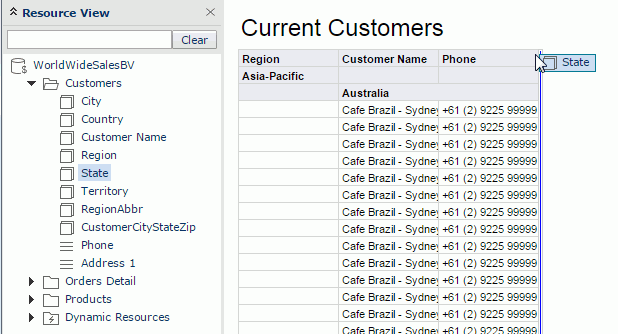
The report tab appears as follows:
- Select blank area in the table, when the icon
 appears at its upper left corner, right-click the icon and select Insert > Detail Column from the shortcut menu.
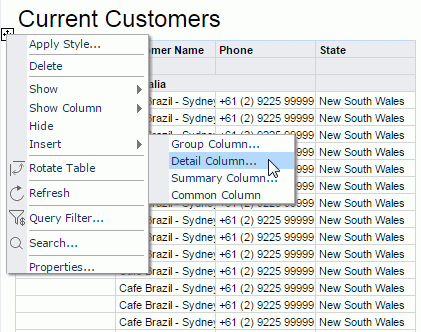
- In the Insert Detail Column dialog, select Address 1 from the Customers category and select OK. A detail column, Address 1, will be added to the right of the State column.
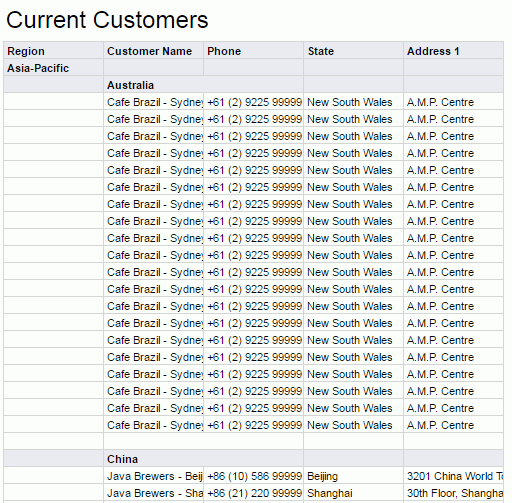
However, we now consider the state information is not very useful because we will care more about the city information. So we can overwrite State with City.
- Drag City in the Customers category from the Resource View panel to the State column label and drop it:
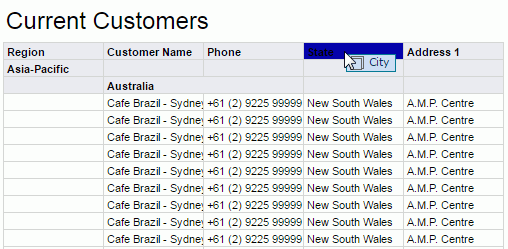
The report result becomes:
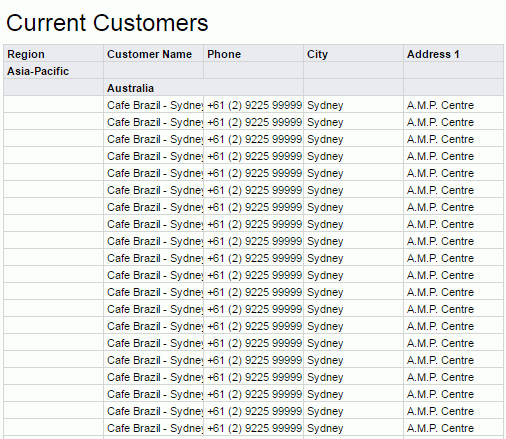
- Resize the Customer Name column by dragging the boundary to the right of the column to make all the customer names in the column displayed entirely.
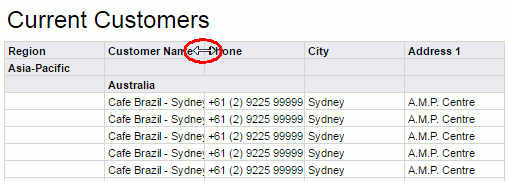
- Repeat the resizing step for the Phone and Address 1 columns.
The report result finally changes to:
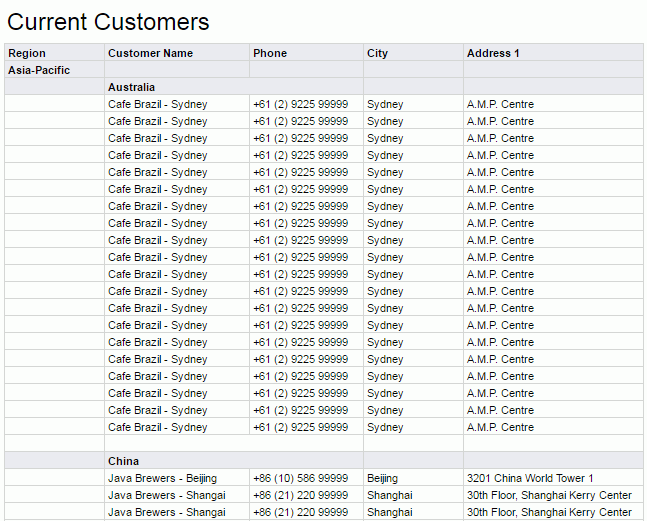
- Select the Save button
 on the toolbar. In the Save Report Template dialog, select Yes to save the report, then select OK in the prompt message window.
Task 7: Analyze Data of a Crosstab
- Select Sales from the Go To drop-down list on the toolbar to switch to the Sales report tab, which contains a crosstab and a chart.
Since Country is a middle level predefined in the hierarchy Geography of WorldWideSalesBV, we can drill it up or down to the adjacent level.
- Right-click any country in the row header, and select Drill Up > Region.

Next we want to go down from Region to Country, however it is not a reversed process of going up from Country to Region, but applying an additional filter.
- Right-click Asia-Pacific in the row header, and select Drill Down > Country from the shortcut menu.
Now, only data of countries in Asia-Pacific is displayed:

We can further drill Country down to State and then to City in this way if necessary. Here, let's leave the crosstab as it is.
- Right-click China in the row header, and select Drill to by Value > Customer Name.
The crosstab is regenerated to show data of customers in China:

- Next, we want to pivot the crosstab, namely interchange the rows and columns. Select the Rotate button
 on the toolbar and the crosstab finally changes to:

-
Select the Save button
 on the toolbar. In the Save Report Template dialog, select Yes to save the report, then select OK in the prompt message window.
Task 8: Analyze Data of a Chart
Now let's focus on the chart at the lower part of the Sales report tab. In JReport, a chart can be converted to a crosstab, and vice versa. So we will convert the chart to a crosstab first.
- Right-click anywhere on the chart and select To Crosstab from the shortcut menu.
- In the Display tab of the To Crosstab dialog, add Product Type to the Columns box, Sales Quarter to the Rows box, and Total Sales to the Summaries box, then select Next.
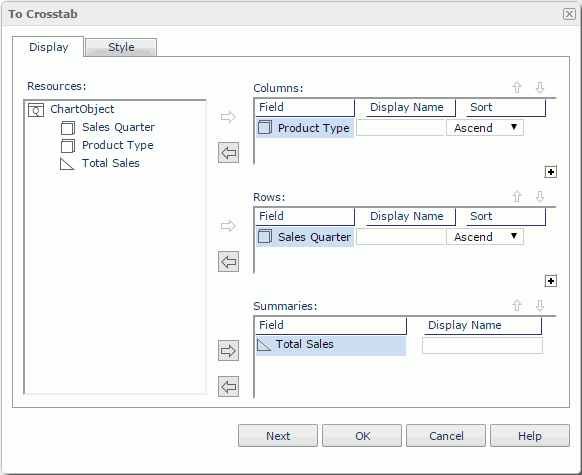
- In the Style tab, set the crosstab style as ClassicBlue, and then select OK. The chart is successfully converted to a crosstab.
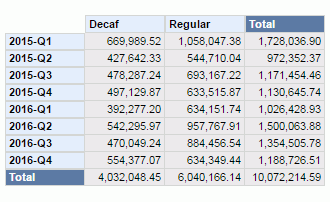
Now, we want to return the crosstab to a chart, and change the chart type to line chart.
- Select the Undo button
 on the toolbar to cancel the operation of converting chart to crosstab.
 - Right-click anywhere on the chart, and on the shortcut menu, select Chart Type > Line > Line 2-D. The chart appears as follows:
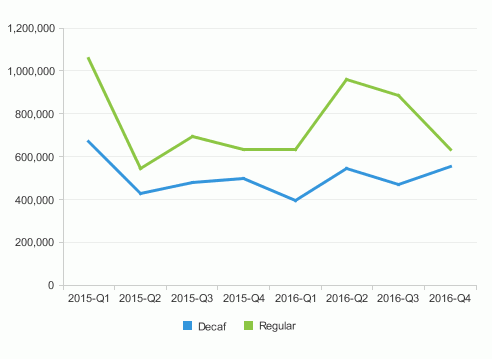
Next, we will format the chart.
- Right-click the platform of the chart and select Format Chart from the shortcut menu.
- In the Chart Type tab of Chart Definition dialog, select Bench from the Chart Type box, and select the Clustered Bench 2-D thumbnail.
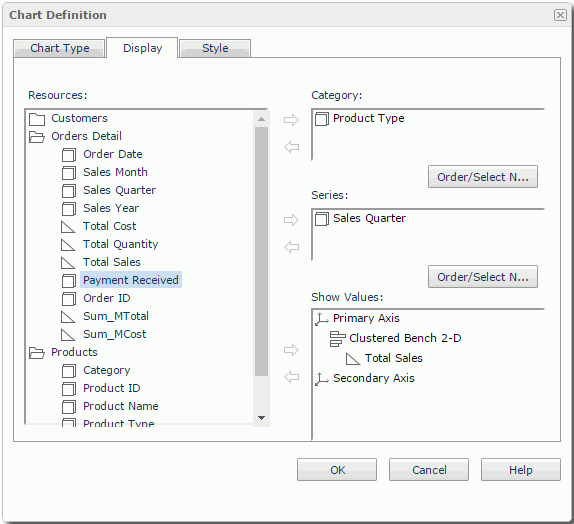
- Select the Display tab, select Sales Quarter in the Category box and select
 to remove it, then expand the Products category in the Resources box and add Product Type to the Category box. Remove Product Type from the Series box and add Sales Quarter in the Orders Detail category to the box. Add Total Sales in the Orders Detail category to the Show Values box.
Then select OK.
- The chart now appears as follows:
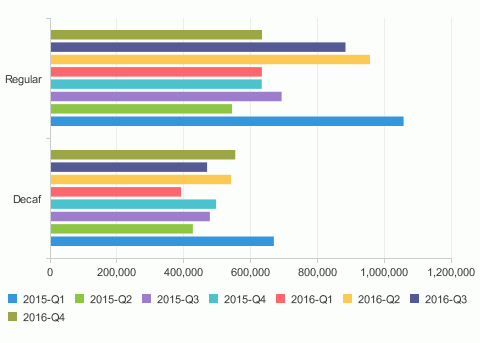
- Right-click the chart and select Format Platform on the shortcut menu.
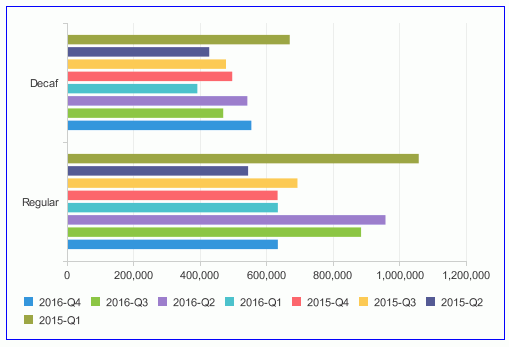
- In the Format Platform dialog, select the Border tab, set Border Type to solid and Color to #0000FF, then select the Data tab, set Sort Category to descend and Sort Series to descend. Select OK to confirm.
Finally the chart looks as follows:
Next, we want to apply a filter to the business view the chart uses to show the data of North America.
- Right-click anywhere on the chart and select Query Filter on the shortcut menu.
- In the Query Filter dialog, specify the filter condition as follows. Select OK to apply the changes.
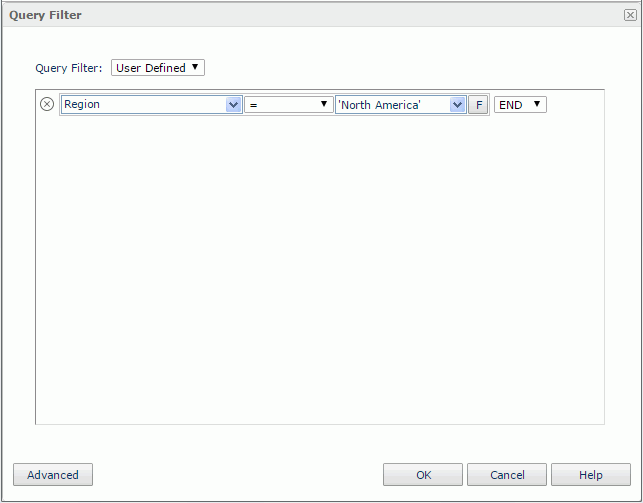
We can find that the filter is then saved as a user defined filter in the business view.
The chart now becomes:
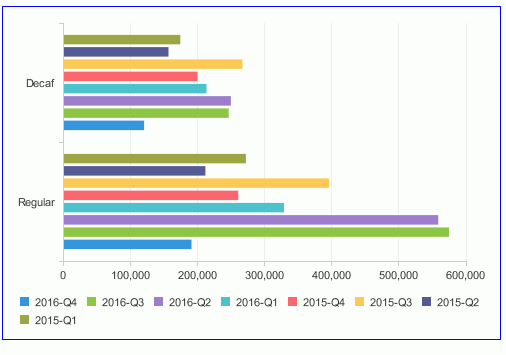
- Select the Save button
 on the toolbar. In the Save Report Template dialog, select Yes to save the report, then select OK in the prompt message window.
 Previous Page