Text Clouds
A "Text Cloud" is a visual depiction of the weighting of words, links, and phrases. The relative font size and color of words or phrases within the text cloud are an indication of their weighting or frequency. This topic discusses the elements provided in Logi Info that make working with text clouds very easy and straightforward.
- About Text Clouds
- Create a Text Cloud
- Customize Text Cloud Appearance
- Add Links
The Text Cloud element was added to Logi Report in v10.1.59
About Text Clouds
Text clouds (and their close cousins, tagclouds) are groupings of words that are visually differentiated by font size, color, etc. in order to reflect their relative weighting, frequency, or other numeric value. The words or phrases may be links, allowing users to drill-down into detail data. The text cloud is similar to another, better known visual depiction of relative weightings, the standard pie chart, but it allows for many more weightings, while providing somewhat less accuracy.
If the text cloud is made up of individual words, their linear organization can be alphabetical, introducing yet another organizational scheme.
Create a Text Cloud
Text clouds are easy to create; the data required consists of the words or phrases and a numerical weighting or frequency value. The following example application will show developers how to use the appropriate Logi Info elements to create a text cloud.
- In Logi Info Studio, create a new application or a new report definition in an existing application.
- Download the sample data for this exercise. If it opens in your browser, right-click it and select "View Source" or a similar source-related option. Then save it to your application's _SupportFiles folder as DevNetSearches.xml. These are the search terms and their frequencies from the DevNet site search log for a few weeks, in an XML file.
Terms="Report"
Frequeny="92"
/> |
The fragment above shows some of the data that's in the sample file. Notice that it contains two data attributes "Terms" and "Frequency." These are the data "columns" you'll be referring to later.
/* TextCloudStyles.css */ BODY { A:link { A:hover { .fontBlue { .fontGreen { .fontOrange { |
- In Studio, under the _SupportFiles folder, add a new style sheet to your application and give it a name of your choice. Copy the class definitions shown above into it, save it, and assign the style sheet to your report definition's Style element.
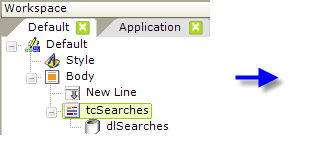
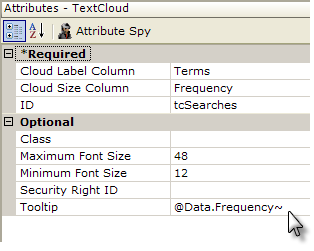
- From within the Charts, Gauges and GIS Maps folder in the Element Toolbox panel, add a Text Cloud element beneath the Body element of your report, as shown above.
- Set the Text Cloud element's Cloud Label Column attribute value to the name of the data column containing the actual words or phrases to be displayed. In the case of the sample XML data, this column is "Terms".
- Set its Cloud Size Column attribute value to the name of the data column containing the numeric weighting of each word or phrase. In the case of the sample XML data, this column is "Frequency".
- Assign a unique ID to the Text Cloud element (entering a value here is required).
- Set the Text Cloud's Max and MinFont Size attributes. These sizes, in pixels, will be assigned to the words or phrases with the largest and smallest weighting values. Words with values in between the maximum and minimum will be given font sizes proportionate to their weighting value.
- Set the Tooltip attribute to the value of the Frequency data column. This will cause the actual weighting value to be displayed when the mouse hovers over any word or phrase.
- Beneath the Text Cloud element, add a DataLayer.XML File element. Set its ID attribute to some unique value and set its XML File attribute to the name of the XML file you downloaded back in Step #2: DevNetSearches.xml.
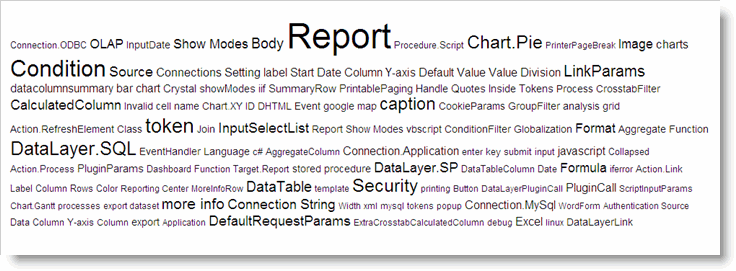
Save and preview your report and you should see the text cloud shown above. When you hover your mouse over the words, their actual frequency in the search log should appear as a tool tip. Notice how the size of the words is related to their frequency.
We used an XML file as the data source for this example, but any type of datalayer element can be used to retrieve the data.
Format Data Using Calculated Column
As with other Logi chart elements, a Calculated Column element can be used to manipulate actual data and create a pseudo-column in the datalayer that is then used in the text cloud.
For example, if your data had separate first and lastname columns but you wanted to display them as a single, combined name in the text cloud, you'd add a Calculated Column element beneath your Text Cloud, set its Formula attribute to combine the two name columns (@Data.FirstName~ @Data.LastName~) and then use the Calculated Column element's ID as the value for your Text Cloud element's Cloud Label Column attribute.
Customize Text Cloud Appearance
We can introduce additional visual differentiations, such as color, font style, etc., to make the weightings stand out more and to make the text cloud more visually interesting. The following example shows you have to use Conditional Classes to give the text cloud fonts different colors based on weighting.
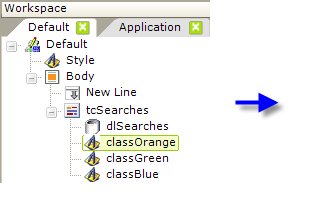
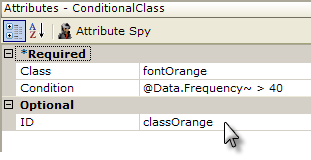
- Beneath the Text Cloud element ("tcSearches") add three Conditional Class elements, as shown above.
- Set the first Conditional Class element's attributes as shown above. The Condition attribute value allows you to apply the class based on the value of the weighting. If the expression in the value evaluates to True, the class will be applied. In this case, all words or phrases with a frequency greater than 40 will be shown in orange.
- Set the attributes for the other two Conditional Class elements similarly. Their attribute values should be:
| Class | Condition | ID |
| fontGreen | (@Data.Frequency~ > 30) AND (@Data.Frequency~ <= 40) | classGreen |
| fontBlue | (@Data.Frequency~ > 14) AND (@Data.Frequency~ <= 30) | classBlue |
The classes assigned in the Class attributes for these elements are all defined in the style sheet you created in Step #3 in the previous section.
Note that Conditional Class elements are evaluated in sequence and that the first class to evaluate to True will be applied and remaining Conditional Class elements will be ignored. This means that the order of your conditional class elements in the report definition may be significant, depending on your evaluation formulae.
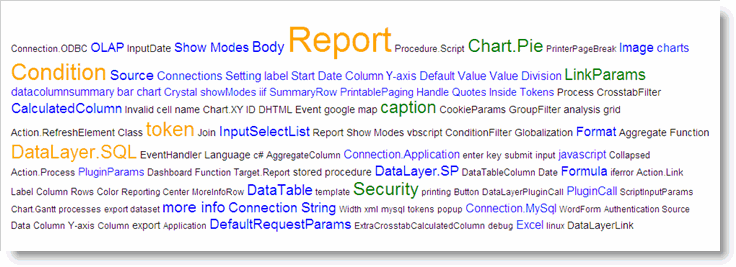
Preview your report and you should see the text cloud shown above. (Any reddish quality you may see here is an artifact from the image reduction process used to fit the image to this page - only four colors: orange, green, blue, and black should be visible in your Preview Panel).
Add Links
The text cloud can also include links that allow a drill-down capability. The sample data you used does not include a URL column, but we'll fake it to illustrate how this feature works:
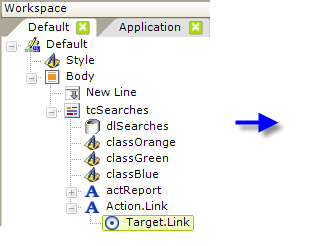
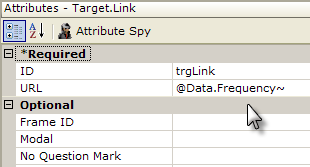
- Add Action.Link and Target.Link elements beneath your Text Cloud element, as shown above (any Action element is valid here.)
- Set the Target.Link element's URL attribute to the column in your data that has the appropriate drill-down destination. Enter the value shown above (@Data.Frequency~) just so that we don't get an error when we run the preview as a URL value is required.

Preview your report. Now when you hover your mouse over a word or phrase, it should be underlined and become an active link, as shown above. Note that the behavior of the links (the underline only appears when hovering over one) in this case is controlled by the two link-related classes in the style sheet you created earlier.
The Text Cloud is an interesting method of displaying and comparing text-type data and, as you've seen, it's very easy to implement in Logi Info.