Trend Line
The Chart Canvas element's Series child elements cause a data visualization (the chart) to be rendered in the canvas. The Trend Line element is available as a child of Series elements and generates a line on the chart that indicates the "trend" of the data. The line connects a number of data points generated using a regression algorithm.
- About the Trend Line
- Attributes
- Including in Legend Items
About the Trend Line
Trend lines provide a visual clue to data trends and are very useful when the type of Series being used doesn't make that readily apparent. The Trend Line element is available for use with Area, Area Spline, Bar, Line, Scatter, and Spline series.

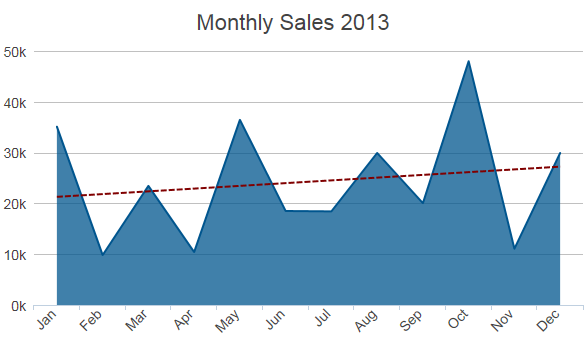
In the example above, the red dotted line is the Trend Line, indicating that the data trend is upward. You can see how that might be difficult to discern from the Area chart itself.
The Trend Line can be any color, can be solid, dotted, or dashed, and you have a choice of regression algorithms.
Attributes
The Trend Line element has the following attributes:
| Attribute | Description |
|---|---|
| Color | Sets the line color. Enter a color by name, decimal RGB value, or hex RGB value. Prefix hex values with the pound sign, e.g. #112233. |
| ID | The unique element ID. |
| Legend Label | Specifies the text that will be shown inside the chart legend for the trend line. A value must be provided here for an entry to appear in the legend. |
| Line Algorithm | Specifies the regression algorithm that will be used to generate the data points plotted by the trend line. Options include LinearRegression (the default) and the curve-fitting LOWESS algorithm. |
| Line Style | Specifies the pattern of the trend line as either Solid (the default) or a combination of dashes and/or dots. |
| Line Thickness | Specifies the thickness of the line, in pixels. The default value is 1 pixel. |
| Transparency | Specifies the transparency of the line color. The lowest value of 0 specifies that the line is opaque, with no transparency. At the other end of the scale, 15 specifies a completely transparent line. |
Include Legend Items
If a legend is used with the chart, Trend Lines can be included in it:

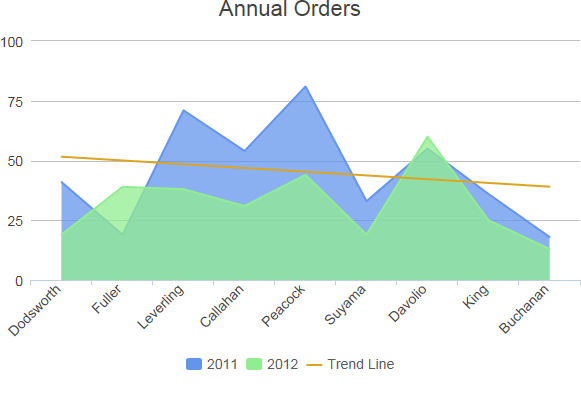
As shown above, the Trend Line appears as an item in the legend. The Trend Line element's Legend Label attribute specifies the text that will appear in the legend and must have a value in order for the Trend Line to be included in the legend.