Input Selection
The Chart Canvas element's Series child elements cause a data visualization (the chart) to be rendered in the canvas. The Input Selection family of elements is available beneath some Series elements and provides the ability to interactively select portions of charts using the mouse and initiate actions using the selected data.
- About Input Selection
- Use Input Selection Point
- Use Input Selection Range
About Input Selection
Input Selection elements turn a chart into an input control, allowing the user to make selections on the chart at runtime. The data represented within the selected chart area can then be used with other actions. Drilling into detail data is one example of how this can be used.
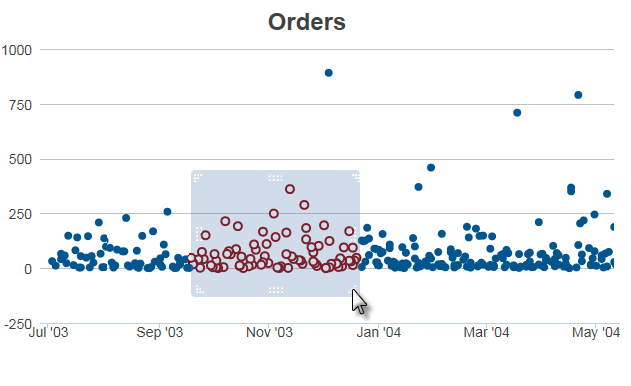
In the example above, at runtime, a "selection area" has been "drawn" (by dragging the mouse)
onto the chart to select values. The values within the selection area are
automatically submitted to the next definition as Request tokens. Page submission may or may not be triggered when drawing the area ends. The appearance of selected areas or points can be independently styled.
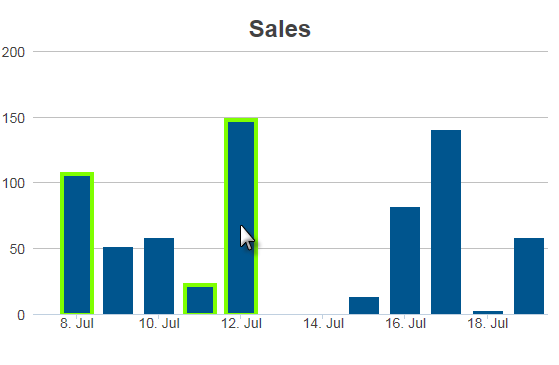
The example shown above uses Input Selection Point configured to allow selection of multiple data points. In this case, the page is submission is not triggered by the selection process.
Let's examine the elements used for chart input selection.
About Input Selection Point
The Input Selection Point element enables the selection, at runtime, of one or more chart data points. This element is available for use with:
|
|
Selection can occur by clicking individual data points or by "drawing" a selection rectangle around them.
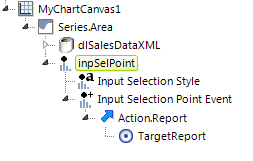
Input Selection Point works with two other elements, Input Selection Style and Input Selection Point Event, along with Action and Target elements, to produce the desired effect, as shown in the typical element arrangement above.
Input Selection Point
This element enables the user interaction and has the following attributes:
| Attribute | Description |
|---|---|
| ID | (Required) This is the unique element ID and is also the name of the Request variable passed when the page input selection action occurs. |
| Change Flag Element ID | Specifies the ID of an element to be set to indicate than an input value has been changed by the user. This is often an Input Hidden element. |
| Point Value Column | When a point is clicked, the default value returned is that of the Series' X-axis Data Column. This attribute specifies the name of an alternate data column to be used. |
| Selection Type | Specifies how users interact with the chart: Options include: ClickSinglePoint (the default) lets users click on individual data points, bars or pie wedges. A previously selected point becomes deselected. Re-clicking the point deselects it. ClickMultiplePoints lets users click on any number of points, bars or pie wedges. Re-clicking a point deselects it. Area lets the user select points by drawing a rectangular region within X- and Y-axis charts. The chart example at the top of the page uses this selection type. This and the following "area" types are not supported for Funnel, Pyramid, and Pie series. AreaXAxis is the same as Area, except the Y-axis region fills the chart. Only the X-axis is selected by the user. AreaYAxis is the same as Area, except the X-axis region fills the chart. Only the Y-axis is selected by the user. |
In the target report or process task, all of the selected values can be referenced using the token @Request.XX~, where "XX" is the Input Selection Point element ID. The token for the example shown above would be @Request.inpSelPoint~.
If multiple selections are made, the @Request token will contain a comma-separated list of selected values. For use with SQL statements, it may be desirable to surround each individual value in the list with single quotes. This can be done using the SingleQuote token modifier. Thus
@Request.inpSelPoint~ which has a value of 1,2,3 becomes
@SingleQuote.Request.inpSelPoint~ which has a value of '1','2','3'
In SQL query "IN" clauses, this is used as "...WHERE LastName IN ('@SingleQuote.Request.inpSelPoint~')...
The Validation.Required element is also available as a child element so a warning message can be displayed if the page is submitted without data points being selected. However, note that the Validation element's Class attribute will not be applied.
Input Selection Point Event
This element specifies, through its child elements, the action to be taken when point selection is completed.
| Attribute | Description |
|---|---|
| ID | The unique element ID. |
| Selection Event | Specifies the type of event that will trigger the action. Options include: Change (the default) triggers the action when the selected status of any data point changes. PointsSelected triggers the action only when points are selected. PointsCleared triggers the action when points are deselected. |
Input Selection Style
This element allows you to style the selection point or area.
| Attribute | Description |
|---|---|
| Border Color | Specifies the color of the border line displayed around selected points. Enter a color by name, decimal RGB value, or hex RGB value. Prefix hex values with the pound sign, e.g. #112233. |
| Border Color Transparency | Specifies the transparency of the selected point border line color. The lowest value of 0 specifies that the line is opaque, with no transparency. At the other end of the scale, 15 specifies a completely transparent line. Use medium-level transparency to allow different chart layers to show through each other. |
| Border Thickness | Sets the thickness of the selected point border line, in pixels. The default value is 1 pixel. |
| Color | Specifies the color of selected points. Enter a color by name, decimal RGB value, or hex RGB value. Prefix hex values with the pound sign, e.g. #112233. |
| Selection Area Color | When using an "Area" Selection Type, specifies the color of the selection rectangle background. Enter a color by name, decimal RGB value, or hex RGB value. Prefix hex values with the pound sign, e.g. #112233. |
Selection Area Color Transparency | When using an "Area" Selection Type, specifies the transparency of the selection rectangle. The lowest value of 0 specifies that the line is opaque, with no transparency. At the other end of the scale, 15 specifies a completely transparent line. Use medium-level transparency to allow different chart layers to show through each other. |
| Transparency | Specifies the transparency of selected points. The lowest value of 0 specifies that the line is opaque, with no transparency. At the other end of the scale, 15 specifies a completely transparent line. Use medium-level transparency to allow different chart layers to show through each other. |
When using Input Selection Point, you may want to turn off the automatic Quicktips generated by the chart. This is done by setting the Chart Canvas element's Auto Quicktip attribute to False.
Use Input Selection Range
The Input Selection Range element enables the selection, at runtime, of a range of data values by drawing a selection area. This element is available for use with:
|
|
Here's an example:
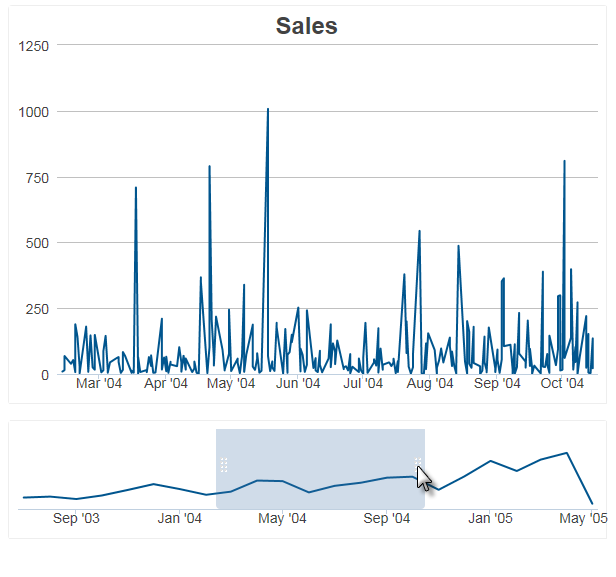
In the example above, the upper chart displays the details of the time window selected in the lower chart.
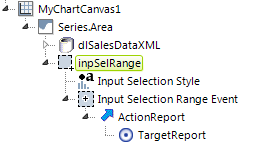
Input Selection Range works with two other elements, Input Selection Style and Input Selection Range Event, along with Action and Target elements, to produce the desired effect, as shown in the typical element arrangement above.
About Input Selection Range
This element enables the user interaction and has the following attributes:
| Attribute | Description |
|---|---|
| Change Flag Element ID | Specifies the ID of an element to be set to indicate than an input value has been changed by the user. This is often an Input Hidden element. |
| Disable Clear Selection | Specifies whether the user can clear the selection area after it's been drawn (this is done by click outside the area). Specifying True prevents the user from doing this. Default: False |
| ID | This is the unique element ID. |
| Max X-axis ID | Specifies the name of a Request variable that will hold the value within the right-most edge of the selection area. Not needed if Selection Type is AreaYAxis. |
| Max Y-axis ID | Specifies the name of a Request variable that will hold the value within the top-most edge of the selection area. Not needed if Selection Type is AreaXAxis. |
| Min X-axis ID | Specifies the name of a Request variable that will hold the value within the left-most edge of the selection area. Not needed if Selection Type is AreaYAxis. |
| Min Y-axis ID | Specifies the name of a Request variable that will hold the value within the bottom-most edge of the selection area. Not needed if Selection Type is AreaXAxis. |
| Selection Type | Specifies how users interact with the chart: Options include: Area lets the user select points by drawing a rectangular region within X- and Y-axis charts. This and the following types are not supported for Funnel, Pyramid, and Pie series. AreaXAxis is the same as Area, except the Y-axis region fills the chart. Only the X-axis is selected by the user. The previous chart example uses this selection type to produce a selection area that can only be dragged left and right. AreaYAxis is the same as Area, except the X-axis region fills the chart. Only the Y-axis is selected by the user. Produces a selection area that can only be dragged up and down. |
In the target report or process task, all of the selected values can be referenced using the tokens named in the Min-Max X-Y Axis attributes. For example, if the attributes are specified as:
Max X-axis ID = myMaxX
Max Y-axis ID = myMaxY
Min X-axis ID = myMinX
Min Y-axis ID = myMinY
Selection Type = Area
and a selection is made, the resulting values can be found in the next report or process task using these tokens:
@Request.myMaxX~
@Request.myMaxY~
@Request.myMinX~
@Request.myMinY~
The Validation.Required element is also available as a child element so a warning message can be displayed if the page is submitted without a chart area being selected. However, note that the Validation element's Class attribute will not be applied.
Input Selection Range Event
This element specifies, through its child elements, the action to be taken when an area selection is completed.
| Attribute | Description |
|---|---|
| ID | The unique element ID. |
| Selection Event | Specifies the type of event that will trigger the action. Options include: Change (the default) triggers the action when the status of selection area changes. AreaDrawn triggers the action when the drawing of the selection area ends. AreaCleared triggers the action when the selection area is cleared (by clicking outside of it). |
Input Selection Style
This element allows you to style the selection point or area.
| Attribute | Description |
|---|---|
| Border Color | Not used with Input Selection Range. |
| Border Color Transparency | Not used with Input Selection Range. |
| Border Thickness | Not used with Input Selection Range. |
| Color | Not used with Input Selection Range. |
| Selection Area Color | When using an "Area" Selection Type, specifies the color of the selection rectangle background. Enter a color by name, decimal RGB value, or hex RGB value. Prefix hex values with the pound sign, e.g., #112233. |
Selection Area Color Transparency | When using an "Area" Selection Type, specifies the transparency of the selection rectangle. The lowest value of 0 specifies that the line is opaque, with no transparency. At the other end of the scale, 15 specifies a completely transparent line. Use medium-level transparency to allow different chart layers to show through each other. |
| Transparency | Not used with Input Selection Range. |
When using Input Selection Range, you may want to turn off the automatic Quicktips generated by the chart. This is done by setting the Chart Canvas element's Auto Quicktip attribute to False.