InfoGo - Dashboard Filters
Your application may have been configured to allow dynamic filtering of the data in Dashboard panels, individually and globally.
Filtering Individual Panels
If panel filtering has been enabled, clicking the panel's gear icon will display a pop-up menu that has a Filter option:
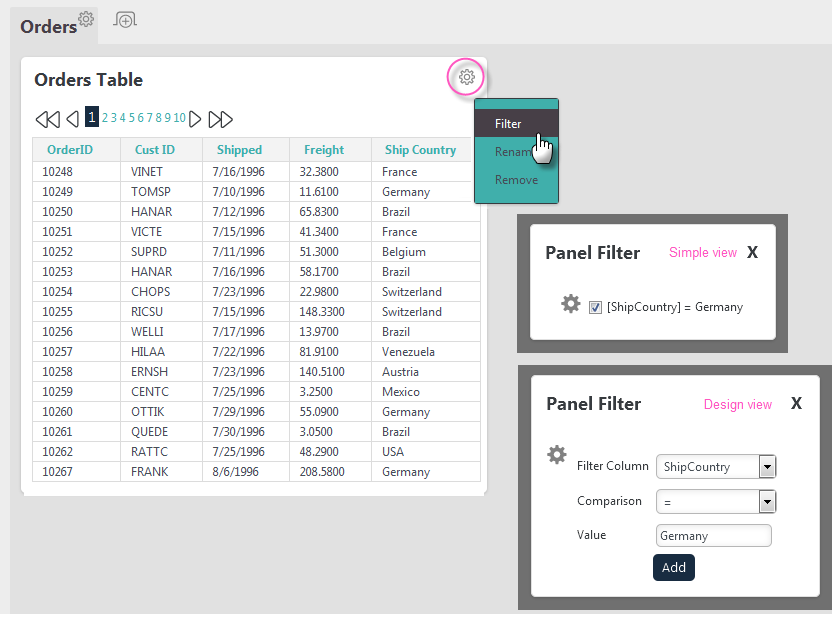
This option will open the Panel Filter panel, as shown above. The controls displayed in it will depend on the view mode, Simple or Design, configured by your application developer.
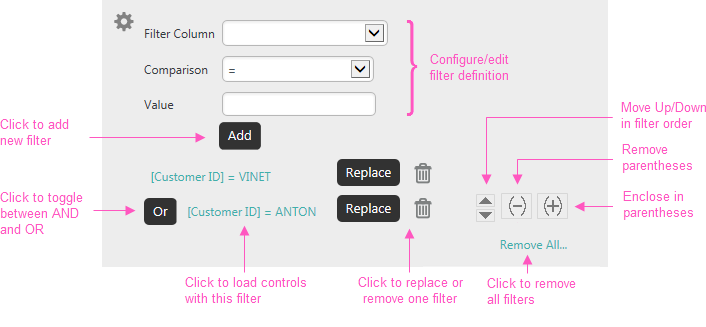
In Design view, you can define and combine filters, using the controls shown above. Adding, changing, or removing filters will immediately filter the data in the Dashboard panel accordingly.
Adding a Global Filter
You can also add a "global" filter, one that affects the data used in multipleDashboard panels at once. This type of filter functionality is automatically available when multiple Dashboard panels have been configured for filtering.
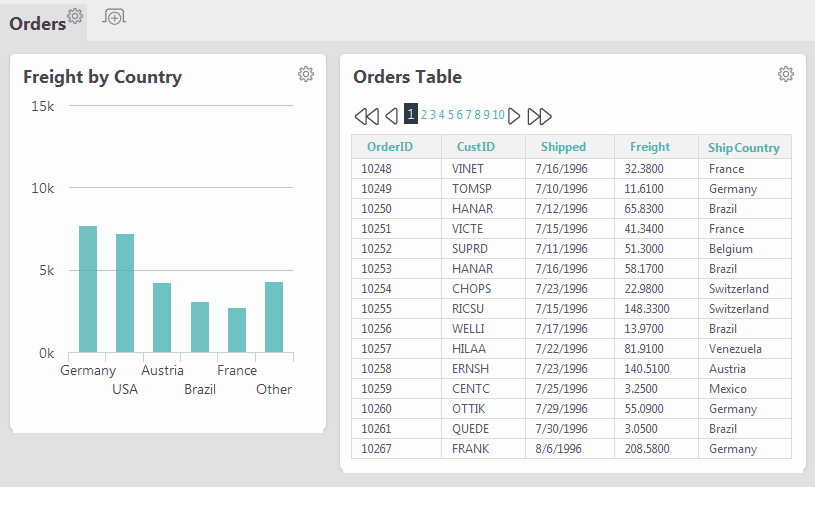
The example Dashboard shown above has two panels, each of which has been
configured for filtering and whose visualizations use data from the
ShipCountry column.
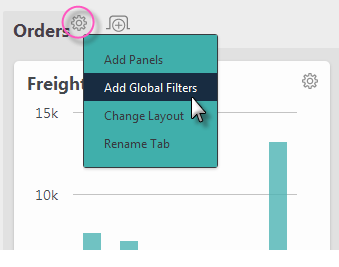
You can create a global filter by clicking the gear icon for the Dashboard tab, as shown above, and selecting the Add Global Filters pop-up menu option.
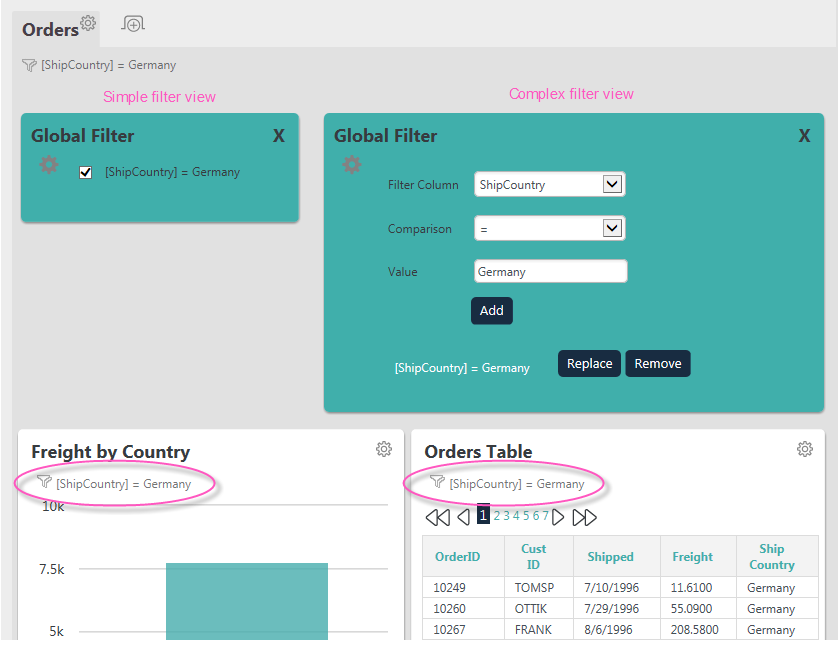
The Global Filter panel will be displayed, as shown above. The controls displayed in it will depend on the configured view mode and have been explained earlier. Once a filter has been created, Dashboard panels with visualizations whose data includes the filter's data columns will be filtered; those that do not include the filter's columns will not be filtered.
Filter descriptions, circled above, will be added to each filtered panel and can be clicked to re-open the Global Filter panel.
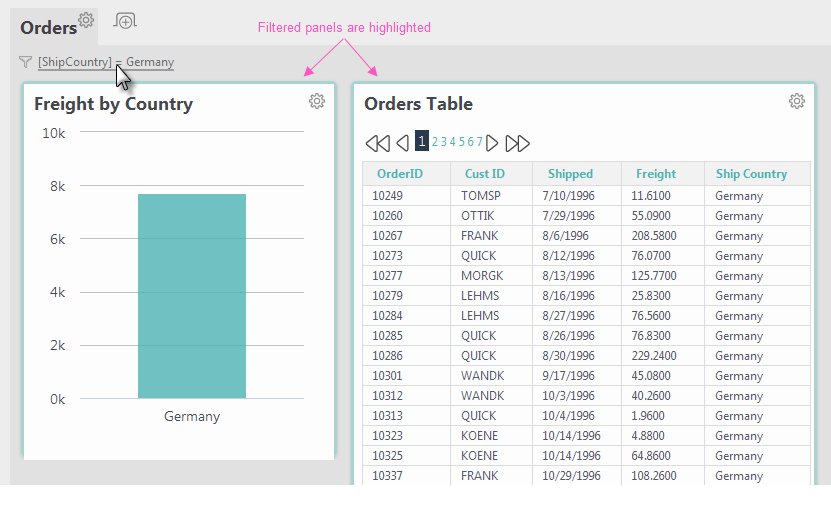
A global filter description will also appear at the top of the tab and can be used as a link to re-open the Global Filter panel. In addition, when you hover your mouse cursor over this description, the panels affected by the filter will be highlighted, as shown above.
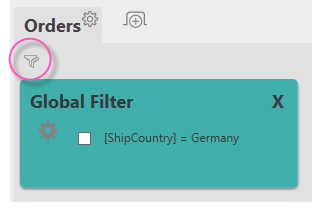
When the Simple view mode is used, filters can be disabled by unchecking their check box. This causes the global filter description to be removed, but a filter icon, circled above, remains as an indicator that a global filter is defined and available for use. Clicking the icon will re-open the Global Filter panel.
Global Filtering using Chart Data Points
If your application has been configured to allow it, you can also create a global filter in a Dashboard by selecting data points in a chart:
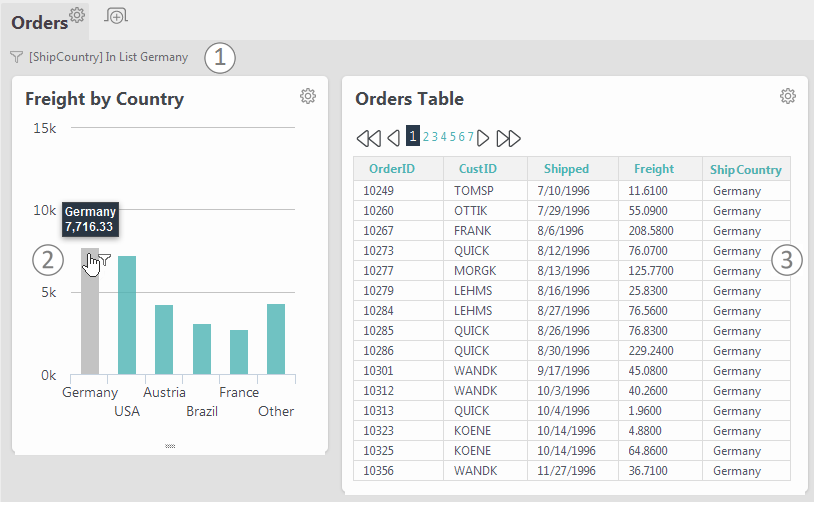
Once again, we have an example with two Dashboard panels, one with a chart and one with a table, shown above. When you click a bar in the chart, a global filter is created automatically and three other things happen:
- A Filter Description appears at the top of the Dashboard tab. This can be clicked to edit the global filter.
- The color of the selected chart bar changes to indicate it's included in a filter.
- The data for the table in the second panel is filtered.
![]() This is different from the previous global filtering example because the chart that was clicked is not filtered.
This is different from the previous global filtering example because the chart that was clicked is not filtered.
Clicking the same chart bar a second time will cancel the filter related to that data. Clicking another bar will add additional criteria to the global filter.
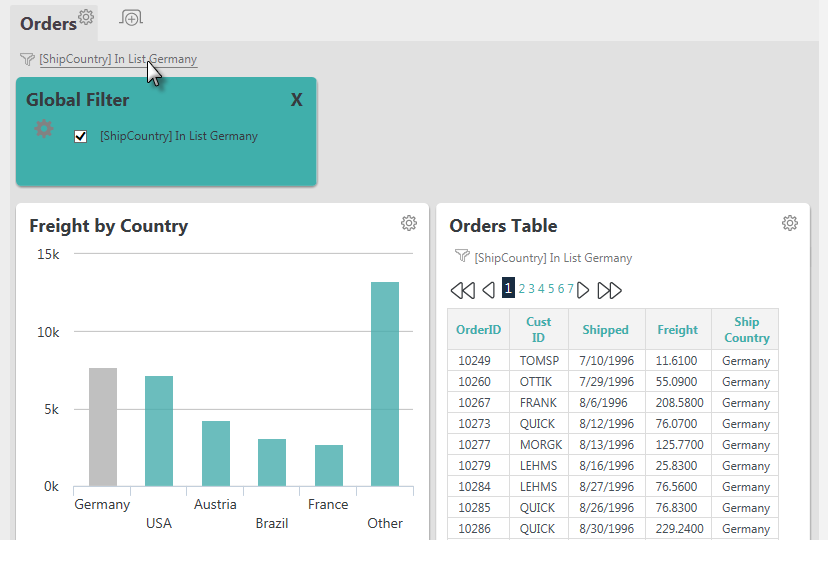
Clicking the Filter Description at the top of the Dashboard tab will cause the automatically-generated Global Filter panel to be displayed. As before, the controls displayed in it will depend on the view mode, Simple or Design, configured by your application developer (only Simple mode is shown above).
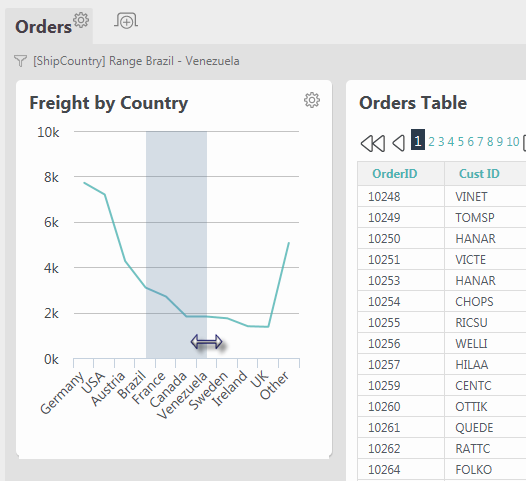
For chart types that support it, you can also create a global filter by dragging the cursor to select a range of values, as shown in the Line chart above. This will create a global filter that includes the selected range of values.