InfoGo - Adding Visuals
When you create a new Dashboard, or when you change tab settings, the Visual Gallery will be displayed.
The Dashboard Tab's gear menu includes an option to add a visualization from the Visual Gallery.

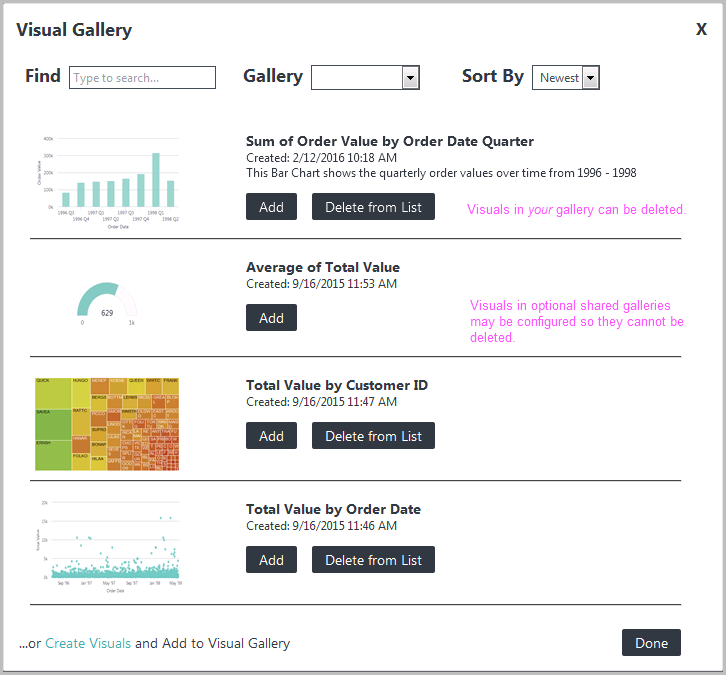
As you can see above, it's a collection of all of the visuals saved in the gallery. You can recognize them from their thumbnail images, and from the titles and descriptions entered when they were saved.
The Find control lets you filter the displayed visuals by typing in the full or partial title of a visual, and the Sort control lets you set the display order of the visuals by Newest or Oldest, or by Title alphabetically.
If your application has been configured for multiple galleries, at first you'll see all of their visuals combined into one big collection. You'll also see the Gallery selection list, which allows you to filter the displayed visuals by gallery.
Each visual has an Add button that adds it, as a new panel, in the Dashboard. You can add several new panels, one after another, if desired. Once a visual has been added, its button disappears and "Added" is displayed.
Panels can be removed from the Dashboard using a control on the panel itself (see InfoGo - Panel Settings Placement). If a panel is removed, its visual will appear in the gallery with its Add button displayed again.
Each visual from your gallery also has a Delete from List button, which deletes it from the gallery. If multiple galleries are in use, visuals from them may or may not have this button, depending on whether their creator configured the gallery to be "read-only".
Use the Done button to close the Visual Gallery.