Build a Chart Definition
And now, let's build a Mobile Report that displays a chart. In the example that follows, we'll be displaying data that can be filtered by year, and include an Input Select List to allow the user to select different years to display.
-
Once again, create a new definition duplicating the initial steps used
for the mDefault definition or copy and alter the mDefault definition as
described in Build a Data Table Definition. However,
no second Division for left-alignment is necessary this time.
-
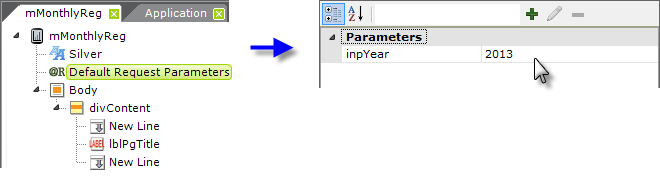
To ensure that our data filtering always has a default value, add a
Default Request Parameters element to the definition, and set its
attributes as shown above.
-
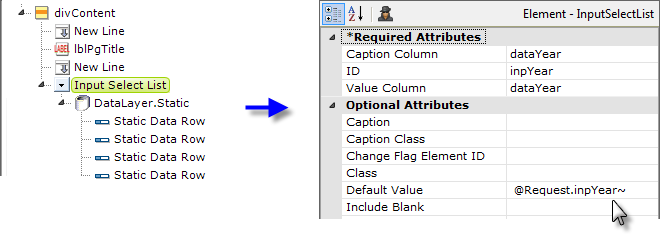
Next, add an Input Select List element, with datalayer and
supporting elements, shown above, to your definition. In the example,
we've used Static Data Rows to provide the years 2010-2013 in the
select list. The list's default value will be its last selected value
or, the first time the report is run, the value of the Default Request
Parameter you created in the previous step.
-
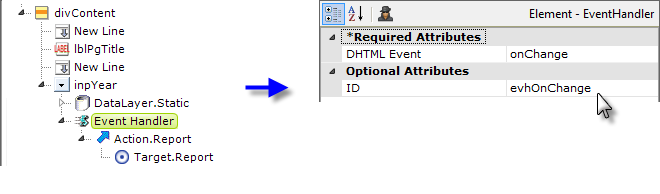
Next, add an Event Handler element beneath the Input Select List
and set its attributes as shown above. Beneath it, add
Action.Report and Target.Report elements. The
Target.Report element's Report Definition File attribute should
be set to the name of the current report definition, i.e.
mMonthlyReg or whatever your definition is named.
-
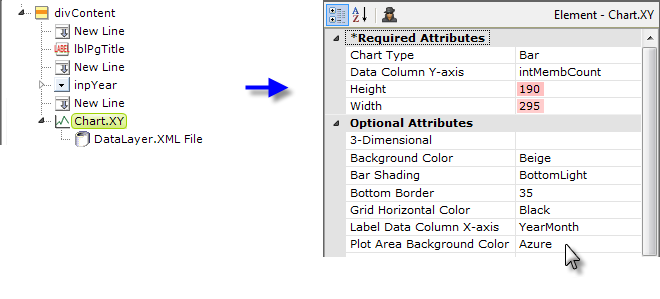
Add a Chart element, as shown above, and a datalayer to retrieve
the data for it. Configure their attributes appropriately. The chart's
Height and Width attributes do not have to be completely
accurate, as we'll be automatically sizing it, but the ratio of
the values you enter is relevant, as it will be preserved during the
automatic sizing. You may care to experiment with different values later
to get the right aspect ratio.
-
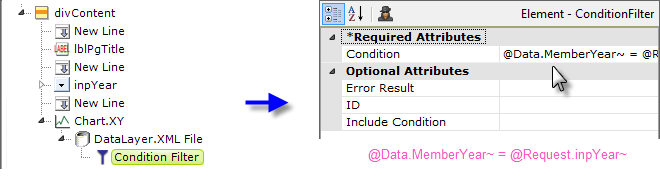
Add a Condition Filter element beneath your datalayer and set its
attributes as shown above. This will ensure that the data displayed
matches the selection the user makes in the Input Select List.
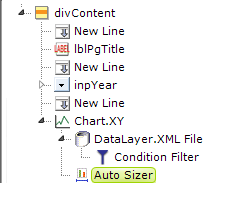
- Now add an Auto Sizer element beneath the chart element, as shown above. There are no attributes to set for this element. It will automatically resize the chart to fit the available width in the mobile device browser window, and resize it if the device is rotated to landscape orientation.
-
Finally, finish up by adding a Label element as a footer, if desired, as
you did in the mDefault definition.
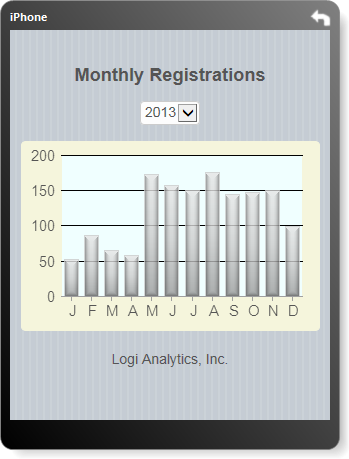
Preview your definition and it should look similar to the example above. You can click the Input Select List and select another year to see how it works. Use your mobile device to browse to the mDefault definition, then tap the menu to navigate to your mobile chart definition.