Analysis Grid - Creating Aggregations
The Aggregate feature enables you to control aggregation functions in your Analysis Grid. You can combine standard calculations or create custom aggregations and save them to use more than once.
For information on how to customize an aggregation, see Analysis Grid - Creating Custom Aggregations.
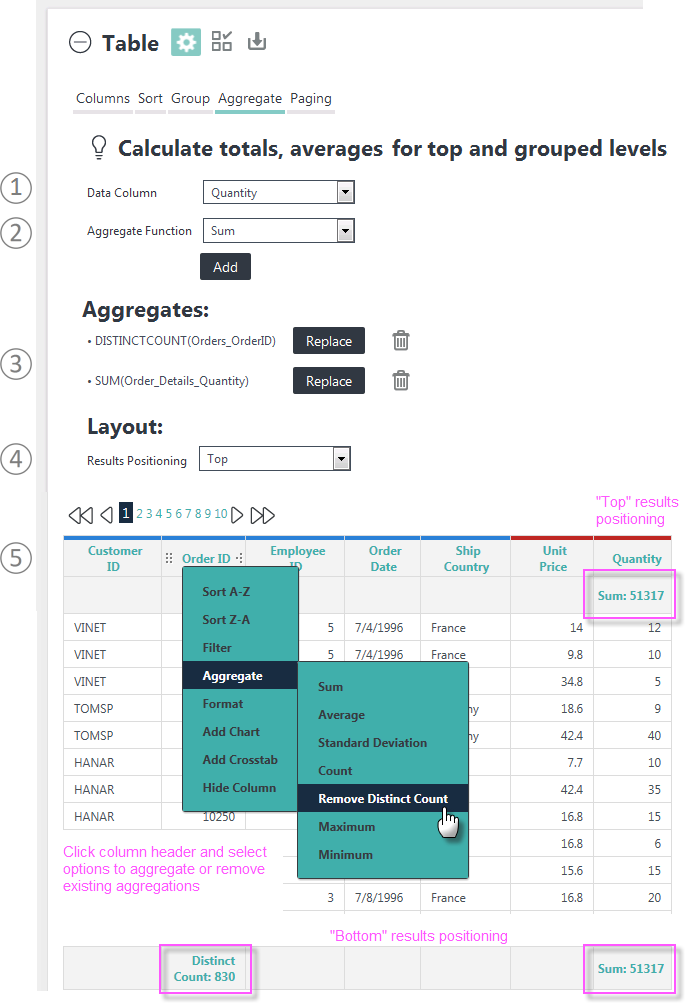
Access this feature by selecting the gear icon or selecting any table column header when viewing a table:

Here's how to use standard aggregations:
- Select the Data Column you want to be part of your aggregation.
- Select the Aggregate Function. Options include: Sum, Average, Standard Deviation, Count, Distinct Count, Minimum, Maximum, and any Custom aggregations you may have.
- Select Add. Logi Info aggregates the data and refreshes the table. Info matches the formatting of the aggregation to that of the column.
- Logi Info adds aggregates to the Aggregate list as they are created. Select the adjacent Replace button or trash can icon to manage the list.
- You can specify that aggregate results appear in an extra table row at the top or bottom of the table, as shown above. If Grouping is in effect, aggregate values will also appear at each grouping level in the table.
- Select the gear icon to hide the configuration area.
By default, columns with Null values are excluded from aggregations. However, you can configure your Analysis Grid to include them; check with your developer for details.
For information about filtering by aggregate, see Analysis Grid - Filtering Rows.