Drill To Dashboard Data
If your application has been configured for it, you can drill into Dashboards in SSRM to gain a deeper insight of the data, without leaving the context of the Dashboard Author. The Drill To feature is useful when reviewing underlying data, which makes up the aggregated number, to answer questions like: of my National sales figures, which states are performing better in the United States, and within each state, which territories are driving revenue? This feature is optional and only available in the Dashboard Author, not the Report Author.
The Drill To feature is available for the following charts:
- Bar
- Pie- date columns cannot be added
- Heat Map- date columns cannot be added
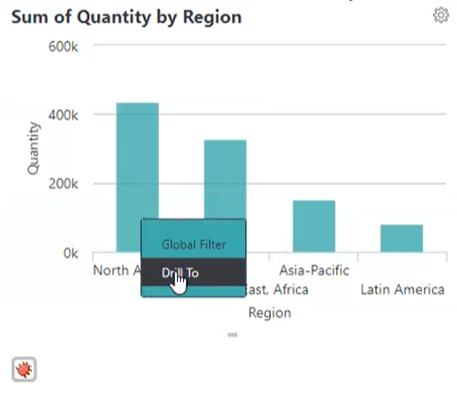
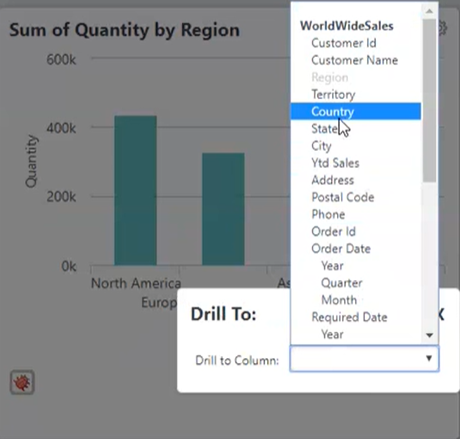
A Drill To: window displays.
- Select the Drill to Column drop-down and select a column from the list, as shown below. Calculated columns that were previously established in SSRM are also available as a Drill To Column.
Info reconfigures the chart to display the data.
The Drill To path displays as a breadcrumb menu at the top of the panel. If there is not enough space on the chart, the breadcrumb menu will show the first and last node with an ellipses. Additionally, if you re-size the chart, the breadcrumb menu will automatically adjust the Drill To path to reflect these changes. In these instances, the ellipses may be the only part of the Drill To path that displays. The ellipses is selectable. Once selected, it will display a drop-down list for the Drill To path, which is also selectable:
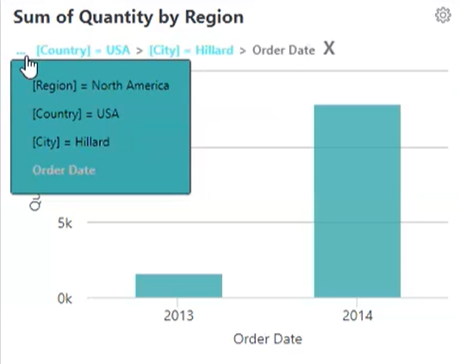
Return to any previous drill states by selecting the node in the drill path, or, select X to return the chart to its original state.
When editing a visualization from the Dashboard, your Drill To state will be kept as long as there are no changes made to the column currently used by the chart. For example, if your chart displays Freight x Order Date and you edit the visualization to display Freight Sum instead of Freight Average, the breadcrumb menu will remain intact. However, if you edit the visualization to display Ship Region x Freight, the breadcrumb menu will reset. For more information about editing a visualization, see Editing Visualizations.
Drill to Date/Time Columns
You can drill into Date/Time Columns by Year, Month, or Quarter in the SSRM Dashboard.
![]() The Date/Time Drill To only applies to bar charts, not Pie Charts or Heat Maps.
The Date/Time Drill To only applies to bar charts, not Pie Charts or Heat Maps.
- To edit the Bar Chart from the SSRM Dashboard, select the gear icon:
![]()
The settings options display.
- Select Edit from the list of options. An Edit Panel displays.
- Depending on your chart axes, select the Label Column or Data Column drop-down and choose Order Date.
- Then, select the Date/Time column by Year, Quarter, or Month:
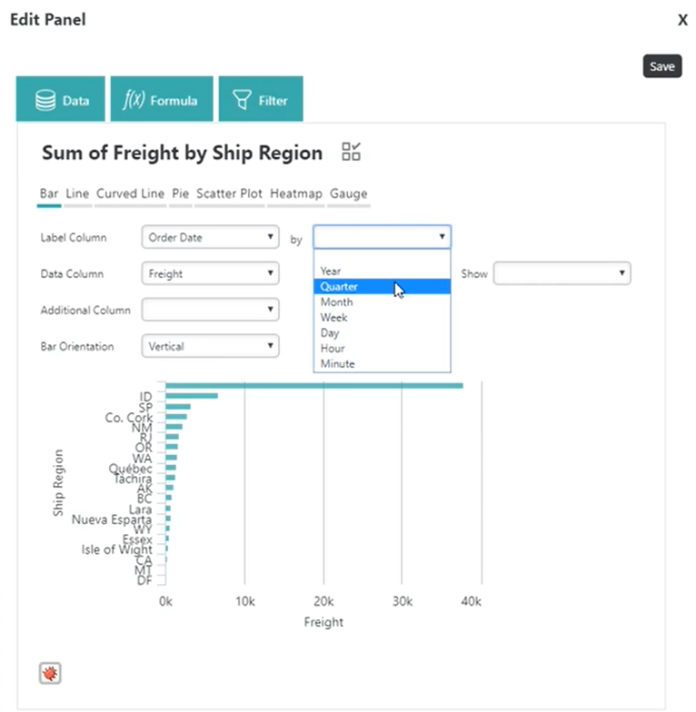
![]() You cannot drill to Week, Day, Hour, or Minute using the Dashboard Drill To feature.
You cannot drill to Week, Day, Hour, or Minute using the Dashboard Drill To feature.
- Select Save to save your changes. The Edit Panel closes and the chart reconfigures to display your changes.
- Select the desired column to trigger the Drill To menu. A Drill To: window displays.
- Select the Drill to Column drop-down and select a column from the list:
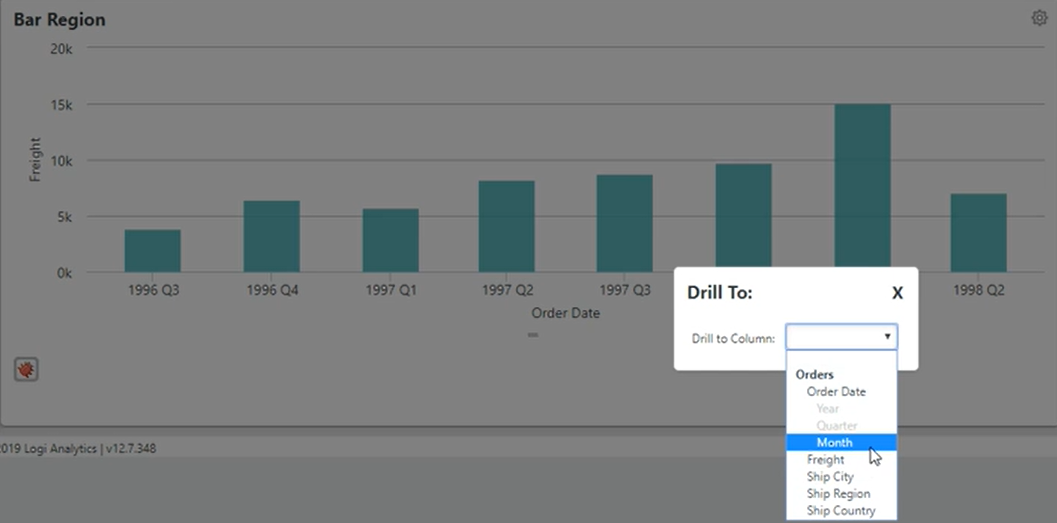
Info reconfigures the chart to display the data.
Saving Drill To
Upon saving, the Drill To selection will be saved in the bookmark.
Sharing Drill To
Shared bookmarks will contain the Drill To selection (if any) applied by the Dashboard Owner.
![]() If the bookmark was shared with you, not created by you, you will not be able to further Drill To or change the current Drill To selection in the Dashboard.
If the bookmark was shared with you, not created by you, you will not be able to further Drill To or change the current Drill To selection in the Dashboard.