Analysis Grid Developers - Using a More Info Row
The More Info Row element can be used to show additional data "inside" a table or Crosstab Table row. The row expands vertically to accommodate rows of additional data or other visualizations.
In order to use a More Info Row element with an Analysis Grid, you must include a regular Data Table Column element as one of your table columns. This is because More Info Row elements are shown/hidden using an Action.Show Element element, which is not a valid child of Analysis Grid Column elements.
Use this Data Table Column to display values, such as invoice, product, or ID numbers, that won't be used for further analysis in the Analysis Grid.

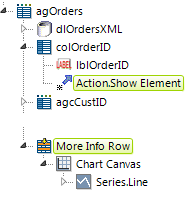
In the example above, Action.Show Element has been added beneath the Data Table Column element "colOrderID". A More Info Row element has also been added, with a Chart Canvas chart beneath it.

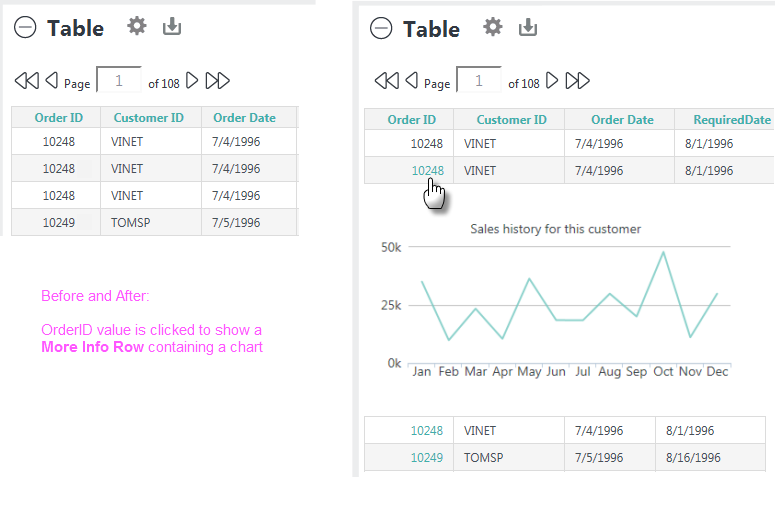
As shown above, clicking the column's value at runtime will then show/hide the More Info Row and whatever it contains.
For more information about the general use of More Info Rows, see Data Table Rows.