InfoGo - Editing Visuals
You can edit visuals generated by Thinkspace analyses directly from their Dashboard panels.
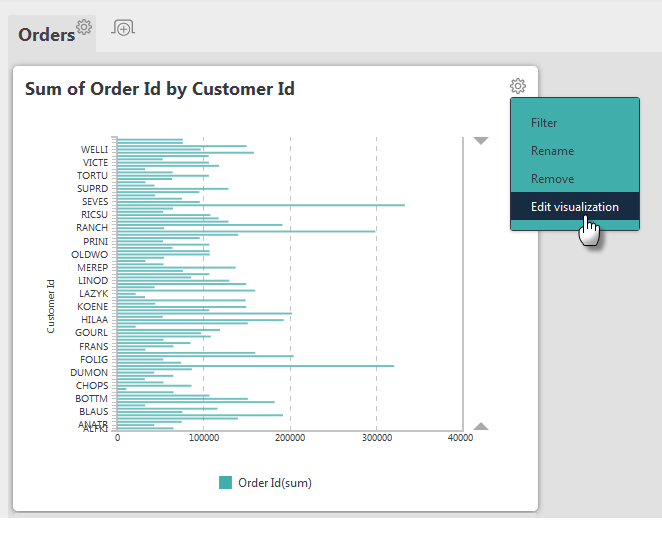
For example, you can click the Dashboard panel's gear icon and select the "Edit visualization" menu option, as shown above.
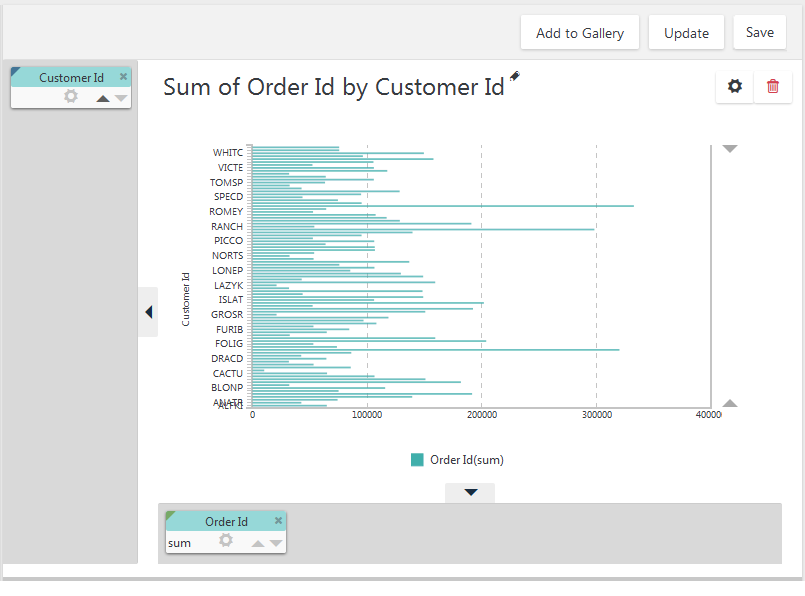
The Thinkspace will be displayed, with the Dashboard panel's visual loaded into it, as shown above.
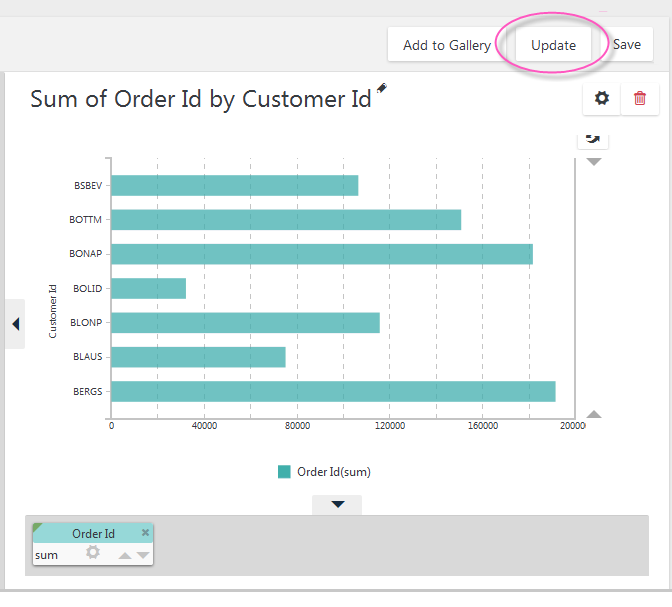
You can then make changes to the visual. In the example above, we filtered the data down to Customer IDs that start with "B". Click Update to save your changes and return to the Dashboard...
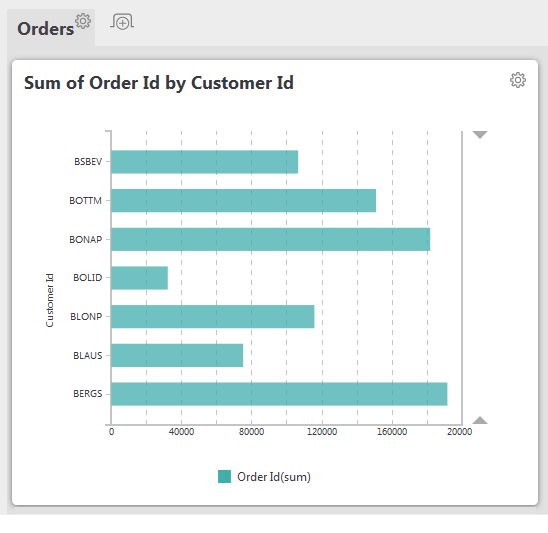
... where, as shown above, the Dashboard panel will be refreshed with the edited visual.
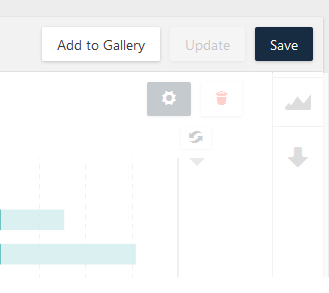
When you're editing the visual in the Thinkspace, depending on how your application is configured, you may also have the option to add the edited version to your Visual Gallery and/or to save it for use in a later session, using the two buttons shown above.