Including and Using jQuery Components
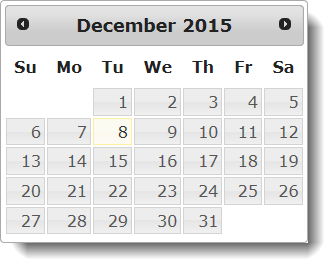
Here are two examples that illustrate how to include the jQuery libraries and jQuery code. The first one displays the "date picker" UI component.
First, we configure our report definition's Style element to use a jQuery style sheet hosted online by Google:
- http://ajax.googleapis.com/ajax/libs/jqueryui/1.11.4/themes/smoothness/jquery-ui.css
The jQuery versions used here are representative and other versions will work as well.

Then we add two Include Script File elements to our definition, as shown above, and configure their attributes to include the jQuery libraries hosted online:
- http://ajax.googleapis.com/ajax/libs/jquery/2.1.4/jquery.min.js
http://ajax.googleapis.com/ajax/libs/jqueryui/1.11.4/jquery-ui.min.js
![]() The Google API hosting page suggests using these URLs with the "https:" protocol. However, if your Logi application is not specifically configured for SSL, then using "https:" URLs to include these libraries will not work. Use "http:" instead, as shown.
The Google API hosting page suggests using these URLs with the "https:" protocol. However, if your Logi application is not specifically configured for SSL, then using "https:" URLs to include these libraries will not work. Use "http:" instead, as shown.
You could, of course, use local copies of the jQuery style sheet libraries, downloaded into _SupportFiles, by just selecting their filenames instead.

Next we add an Include Script element and enter our jQuery code in its Included Script attribute, as shown above. The full code is:
$(document).ready(function() {
$("#divDatePicker").datepicker();
});
And finally, we need to add a container (a Division element) for the date picker,

as shown above. The Output HTML Div Tag attribute must be set to True and notice that the ID of the division is used in the jQuery code, which is case-sensitive.

When you run the report, you should see a fully-operational date picker calendar similar to the one shown above.
![]() The date picker highlights the current date (default), as well as the selected date.
The date picker highlights the current date (default), as well as the selected date.
The jQuery News Ticker
The next example demonstrates a little more integration with standard Logi elements. It uses a datalayer as the source for "news headlines", one of which is displayed for a fixed interval before being replaced by the next headline, a classic "news ticker".
Begin by adding the following two style classes to a local style sheet:
#ticker {
height: 20px;
width: 500px;
overflow: hidden;
border: 2px Green Solid;
padding: 5px;
}
#ticker li {
height: 30px;
font-family: Verdana, Arial, sans-serif;
font-size: 12pt;
color: orange;
}
Then assign that style sheet to your report definition, using a Style element.

Use the same two jQuery libraries from the previous example. Add an Include Script element, as shown above and use the following jQuery code for its Included Script attribute value:
function tick(){
$('#ticker li:first').animate({'opacity':0}, 200, function () { $(this).appendTo($('#ticker')).css('opacity', 1); });
}
setInterval(function(){ tick () }, 4000)
![]() There is only one long line of code in the function tick( ) but it may have wrapped to look like two lines in your browser.
There is only one long line of code in the function tick( ) but it may have wrapped to look like two lines in your browser.

Now, add a Data List element in the report Body, as shown above. Its ID, "ticker", matches identifiers in the jQuery code and CSS, so you need to enter it exactly as shown.

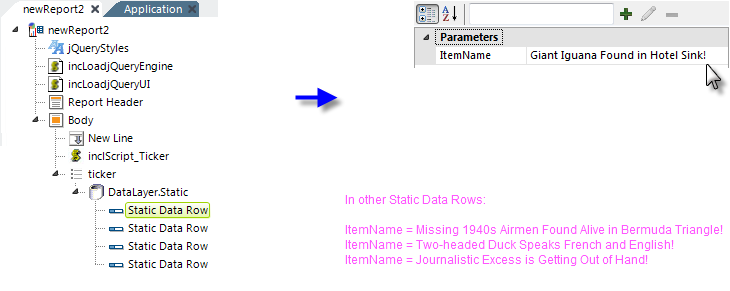
Next, add a DataLayer.Static element and four Static Data Row elements. This, of course, could be any type of datalayer. Set the four data row elements to each have a single column called "ItemName" and enter one of the four headlines for each element, as shown above.

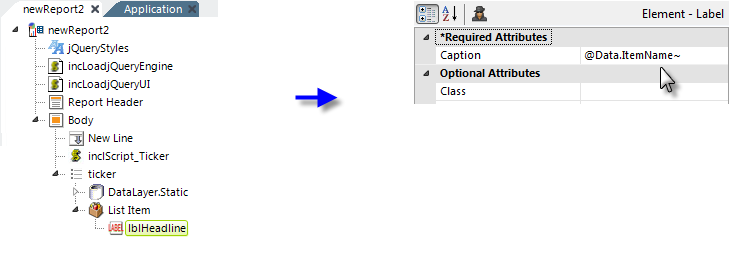
Finally, add a List Item element and, beneath it, a Label element. Set the Label element's Caption attribute as shown above.
So - what you've created is a datalayer-driven, HTML un-ordered list and the jQuery code will display one line of the list at a time.

Run the application and you should see something like the example above, with each headline rotating through it.
Now you can begin to see how the jQuery code can interact with other HTML components created by Logi elements, with CSS, and with data from a datalayer. The next sections look at data manipulation in more detail.