Embedding Logi Visualizations
In this final example, we'll draw a state map and add an overlay layer of polygons, representing the state's counties, as before. This time, however, when a county is clicked we'll display a pop-up panel that contains a Logi visualization (a bar chart) displaying the county's population size in two different years. This will be driven again by U.S. Census data from an online source and we'll use the JavaScript from the ArcGIS Sample web site to render it, using API v3.9.
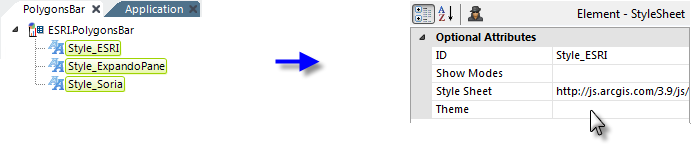
Once again, we'll begin by adding three Style elements, as shown above, to a new definition. The style sheets for this example are:
- http://js.arcgis.com/3.9/js/esri/css/esri.css
http://js.arcgis.com/3.9/js/dojo/dojox/layout/resources/ExpandoPane.css
http://js.arcgis.com/3.9/js/dojo/dijit/themes/soria/soria.css
The third style sheet is for one of four Dojo Dijit themes available: claro, tundra, soria and nihilo. Feel free to try out different themes.
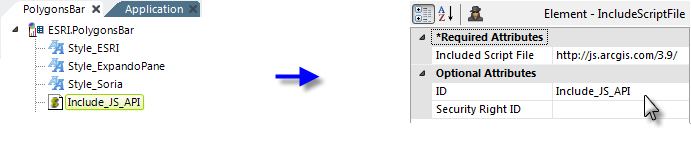
Next, we need to include the ArcGIS API library, using an Include Script File element, as shown above. The complete URL for the v3.9 API is: http://serverapi.arcgisonline.com/jsapi/arcgis/3.9/
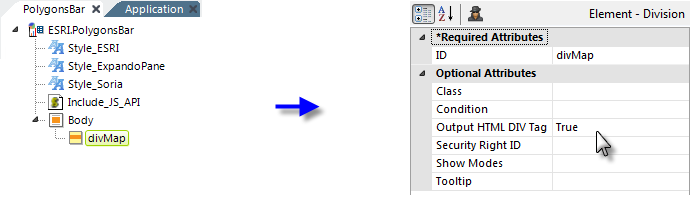
And, once again, we add a Division element, as shown above, which will be the ArcGIS map container. Its attributes are set to give it a unique ID and to ensure that it's rendered as a DIV tag. You can control the size of the map by using CSS to set the height and width of this container element.
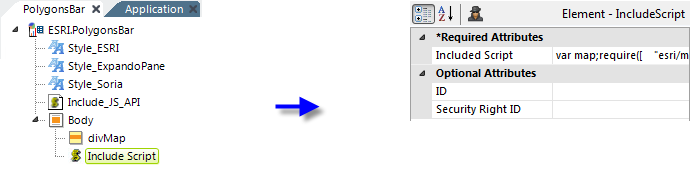
Next, using an Include Script element, we add the JavaScript code to create and initialize the map. Our code looks like this:
var map;
require([
"esri/map",
"esri/InfoTemplate",
"esri/layers/FeatureLayer",
"esri/renderers/SimpleRenderer",
"esri/symbols/SimpleFillSymbol",
"esri/symbols/SimpleLineSymbol",
"dojo/dom",
"dojo/number",
"dojo/on",
"dojo/parser",
"esri/Color",
"dijit/layout/BorderContainer",
"dijit/layout/ContentPane",
"dojox/layout/ExpandoPane",
"dojo/domReady!"
],
function (
Map, InfoTemplate, FeatureLayer, SimpleRenderer, SimpleFillSymbol,
SimpleLineSymbol, dom, number, on, parser, Color
) {
parser.parse();
map = new Map("divMap", {
basemap: "streets",
center: [-75.18, 42.34],
zoom: 7
});
var infoTemplate = new InfoTemplate();
infoTemplate.setTitle("County Census Data");
infoTemplate.setContent("<iframe src=\"http://@Function.ServerName~/@Function.AppVirtualPath~?rdReport=CountyChart&County=${NAME}, ${STATE_NAME}&pop2000=${POP2000}&pop2007=${POP2007}\" frameborder=0 width=250 height=290></iframe>");
var counties = new FeatureLayer("http://sampleserver1.arcgisonline.com/ArcGIS/rest///services/Demographics/ESRI_Census_USA/MapServer/3", {
mode: FeatureLayer.MODE_SNAPSHOT,
infoTemplate: infoTemplate,
outFields: [
"NAME", ,"STATE_NAME", "POP2000", "POP2007", "POP00_SQMI",
"POP07_SQMI"
]
});
counties.setDefinitionExpression("STATE_NAME = 'New York'");
//apply a renderer
var symbol = new SimpleFillSymbol(SimpleFillSymbol.STYLE_SOLID,
new SimpleLineSymbol(SimpleLineSymbol.STYLE_SOLID,
new Color([255, 255, 255, 0.35]), 1),
new Color([109, 146, 155, 0.35]));
counties.setRenderer(new SimpleRenderer(symbol));
map.addLayer(counties);
});
Note these items in the code:
- The "divMap" identifier of our map container Division element is used in the Map constructor.
- In this example, values for the map center point and zoom factor are hard-coded, but they could come from tokens, as in the earlier example.
- An "InfoTemplate" is created for the pop-up panel that appears in response to clicks on the polygons. It includes the HTML to embed a different Logi report in an iFrame.
- The polygon overlay (the "FeatureLayer") reads data from an ArcGIS online sample source. Data retrieved is passed to the Logi report in the Info Template as a request variables in iFrame URL.
- A "SimpleFillSymbol" object is used to change a polygon's outline color when it's clicked.
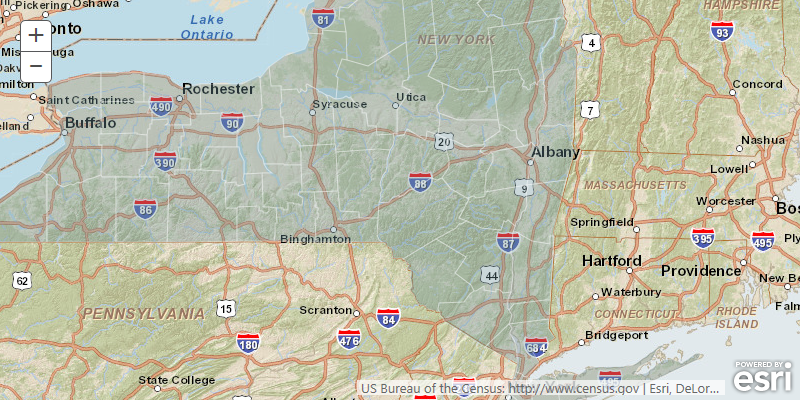
If we preview the definition, we'll see the map shown above. The zoom controls and ESRI logo can be controlled using different API options.
Now let's add the separate Logi report definition that's going to appear in an iFrame in the pop-up panel.
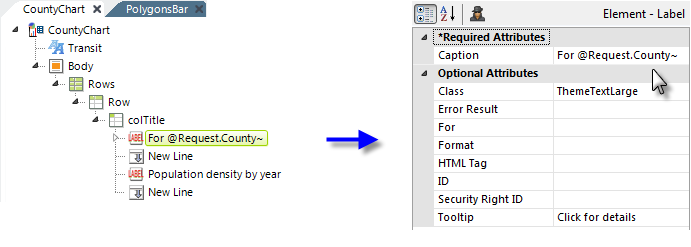
Create a new definition, give it the name "CountyChart" (which matches the iFrame source URL in the JavaScript code above) and add some element for style, structure, and information, as shown above. The Label element shown above uses one of the request variables passed in from the iFrame URL and it also has a Action.Link element (not shown) which uses the same request token to create a link to search for the county in Google.
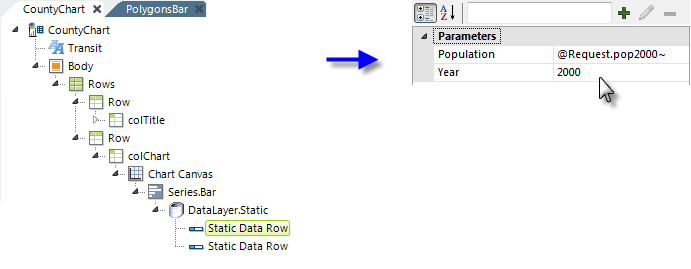
And, finally, we add a set of elements for a Chart Canvas Chart, with a Bar series, as shown above. We have a fixed number (two) years of data, so we can use a DataLayer.Static element to receive the request variable data passed in the iFrame URL and place it in a datalayer to be used by the chart.
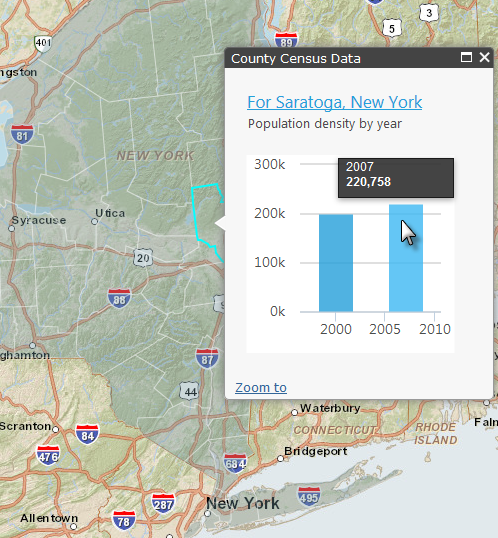
Now when the map is displayed the counties are shown in a polygon overlay, as before, and if a polygon is clicked, as shown above, a pop-up panel provides the data for that county, as a chart. The title is shown as a live link and all of the Chart Canvas Chart features, including hover-highlighting and Quicktips are present.
We've seen how easy it is include ArcGIS maps into a Logi application, using static and online data. You can, of course, use any of the datasources Logi Info can access to produce JSON data to be consumed by a map.