Logi XOLAP - Data Cubes
A data cube is a collection of data that allows analysis in multiple "dimensions".
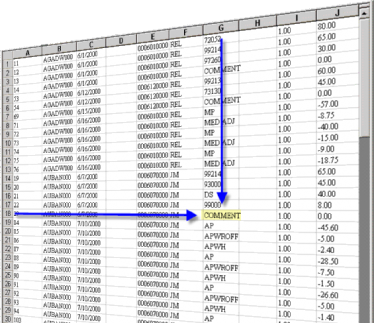
Consider, for example, a spreadsheet. This is a classic arrangement of data in two dimensions: rows and columns. The intersection of a row and column provides us with a specific data value:

We can also use all of the column values along a single row or down a single column for comparison or summarization purposes. This row-column model also describes a database table.
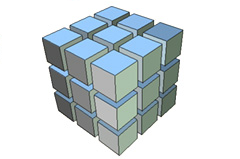
Now, let's consider what happens when we "stack" several identically-formatted spreadsheets, one behind the other. If we pick a specific cell in the front sheet and "drill through" it, we can examine and compare the values for that one cell on all of the sheets. This is a "three-dimensional" comparison or summarization, and an example of how data can be arranged into a "cube". The drill-through provides a third dimension. This is particularly useful in comparing or summarizing data over time. The data cube, which is the foundation of Online Analytical Processing, or OLAP, is particularly useful in finding trends in very large amounts of data.
OLAP data cubes are usually marvels of data warehouse engineering, and
designing and implementing them is a time-consuming, complicated process.
Specialized database servers are often employed and queries made against
an OLAP cube use a special query syntax (MDX) that's similar, but notably
different, from that of standard SQL queries.
Logi Info includes OLAP elements that can issue these queries against cubes created using Microsoft SQL Server Analysis Services and the results can be viewed, aggregated, summarized, and visualized. Logi Info, however, does not create OLAP cubes. More information can be found in Logi OLAP.
Using Data Cubes
Working from the premise that there can be useful multi-dimensional analysis of data that's not necessarily in an OLAP cube, Logi Info includes the ability to create similar data structures on the fly and report on them.

At run time, a Logi Info report can query a wide variety of data sources and build a temporary, XML-based virtual data cube from the results.
Specialized Logi Info elements allow analysis of, and reporting on, these XML cubes. Logi XML Online Analytical Processing, or Logi XOLAP, delivers much of the analytical power of data cubes without the overhead associated with building large OLAP systems.
Naturally, there are some limits. While Logi XOLAP is similar to OLAP in its analytical methods, it doesn't necessarily support the same scale.
OLAP cubes usually include vast amounts of often historical data and are designed with a range of queries in mind, so that specific and ad hoc queries can be handled. They are relatively permanent structures and are often only dynamic in that new data is constantly added to them. Essentially, an OLAP cube is designed and built long before the first query against it is issued.
Logi XOLAP, on the other hand, builds a virtual data cube on demand in response to specific query from an individual user. Therefore, queries that involve millions of result rows may result in unacceptably slow performance. As with all attempts to quantify database limits, a number of factors such as the number of columns, data types, and the number of concurrent queries make it difficult to provide specific row limits.
![]() Logi XOLAP is generally optimized for 10's to 100's of thousands of
records, and with the benefit of the
Hybrid Caching
of the Logi Server Engine, it can also scale based on hardware such as RAM
and CPU/Processing power.
For more information, see Hybrid Caching.
Logi XOLAP is generally optimized for 10's to 100's of thousands of
records, and with the benefit of the
Hybrid Caching
of the Logi Server Engine, it can also scale based on hardware such as RAM
and CPU/Processing power.
For more information, see Hybrid Caching.
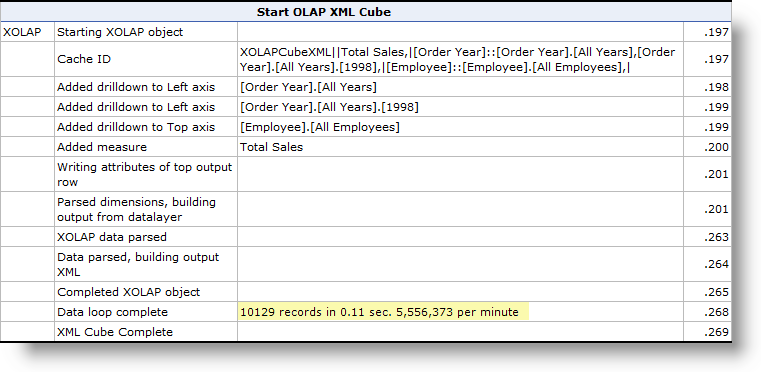
Logi XOLAP performance is monitored in a special section of the Logi Info Debugger Trace Page, so you can see how long it takes to process your data.

For example, the Debugger entry above shows that it took just over 1/10th ofa second to query the data and create a Logi XOLAP cube using a 10,000+ record data set on a desktop-class PC. This can be extrapolated, given the exact same data, cube dimensions and measures, and query load, to 5.5 million+ rows a minute. We can't guarantee a specific performance level but this example is representative.
The ability to create virtual cubes of XML data, even from data sources not normally associated with OLAP, and report on them is a fantastic capability that allows new opportunities for data analysis.