Logi OLAP - Elements
Logi Info's family of OLAP-related elements provides both an OLAP Grid super-element, a tool with a built-in user interface that allows users to filter, analyze, and visualize data, and an OLAP Table element similar to a standard Data Table. The following examples focus on the OLAP Grid; the OLAP Table is discussed in Logi OLAP - Using the OLAP Table.

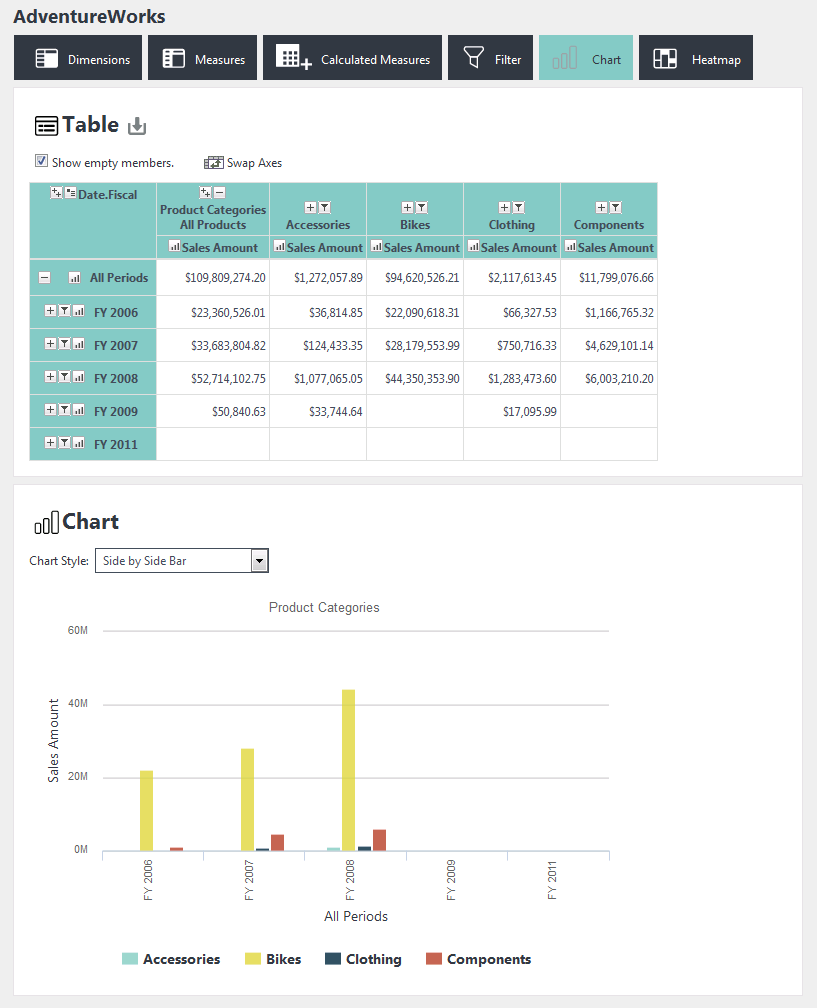
An example of the OLAP Grid in use is shown above. The buttons across the top show and hide feature panels, including: Dimensions, Measures, Calculated Measures, Filter, Chart, and Heatmap. By default, the OLAP Grid includes all of the buttons shown, but it can be configured, or restricted by security, to include fewer buttons and panels, if desired. At runtime, users can:
- Select Dimensions for the left and top axes
- Select Measures
- Select Filters for slicing the data
- Drill-down on Dimension members
- Create charts
- Drill-through to underlying data
With all these possibilities, it may be important for the user to be able to save these settings between sessions. Info developers can create a Process Task that uses Procedure.SaveOlapGrid to do this. A saved OLAP Grid can be reloaded with the rdOgLoadSaved parameter, for example: rdOgLoadSaved = myFilename.xml
Users' settings are automatically maintained during the session but can be cleared by calling the OLAP Grid element's report with the rdOgReset parameter, for example: rdOgReset = True
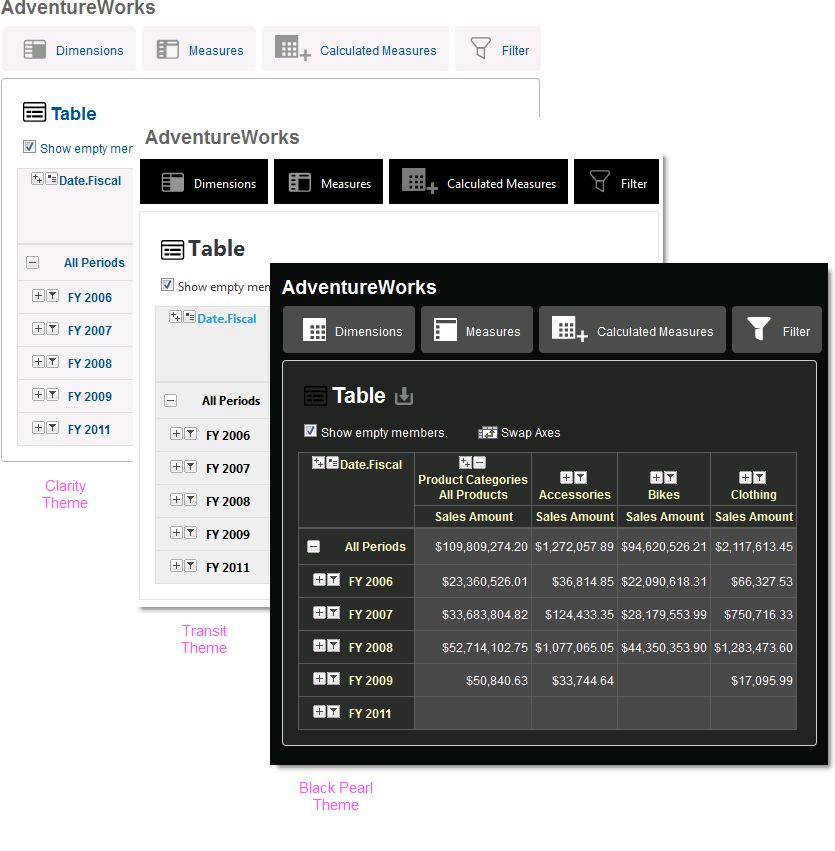
The example shown above uses the standard Signal theme to style the grid. Here are some of the other standard themes in action:

As you can see, the user interface looks quite different depending on the theme that's applied by the developer.
It is very important that the value of the ID attribute for the OLAP Grid element be unique throughout the entire application. This is because Logi Info saves the last state of the OLAP Grid in a user's session information based on the grid's ID. Consequently, if two different report definitions contain an OLAP Grid with the same ID value, the application will display the same grid for both reports.
Caveats and Limitations
![]()
Chart Canvas charts are used by default by the OLAP Grid in all new applications. Older Logi applications that are upgraded to v12 will use the classic static charts for their OLAP Grids. To force upgraded apps to use Chart Canvas charts, add the constant rdFavorChartCanvas = True to your _Settings definition.
The maximum number of rows that can be displayed in the OLAP Grid's data table is 2,000.
We do not recommend that you use any Logi OLAP elements within an embedded sub-report.