Chart Definition Dialog Box Properties
You can use the Chart Definition dialog box to modify the definition of a chart. This topic describes the properties in the dialog box.
This topic contains the following sections:
OK
Select to apply any changes you made here and exit the dialog box.
Cancel
Select to close the dialog box without saving any changes.
Help
Select to view information about the dialog box.
Chart Type Tab Properties
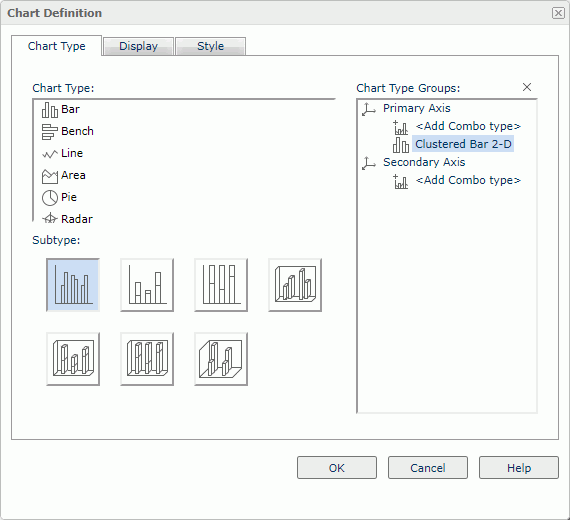
Specify the type of the chart.

Chart Type
Select a chart type.
Subtype
Select a subtype of the selected chart type.
Chart Type Groups
Server lists the subtypes you selected for the chart.
If you want to create a combo chart, select <Add Combo Type> under Primary Axis or Secondary Axis. Server adds an additional subtype. To change the additional subtype, select it, then select another chart type and its subtype respectively. To add more subtypes, repeat the procedure.
 Remove button
Select to remove the selected subtype. At least one type should remain for the Primary Axis to create the chart.
Display Tab Properties
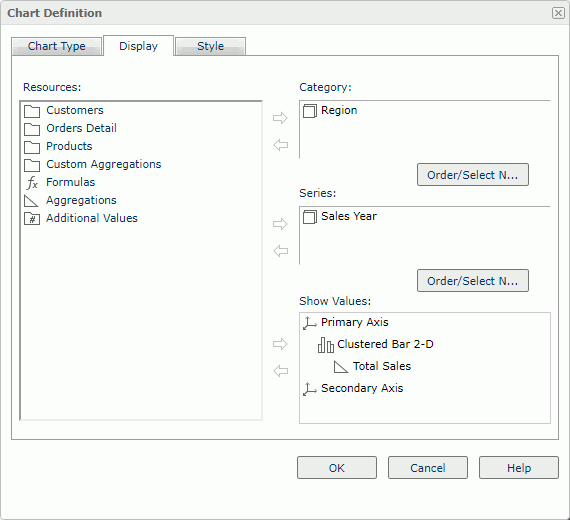
Specify the fields you want to display in the chart.

Resources
Server displays all the group objects and aggregation objects in the chart. Select one non-folder resource and then select the Add button  beside the Category, Series, or Show Values box to add it into the corresponding box.
Category
Server lists the group object  you want to display on the category axis of the chart. If you do not want the current resource, select it, and then select the Remove button
  on the left to remove it.
Series
Server lists the group object  you want to display on the series axis of the chart. If you do not want the current resource, select it, and then select the Remove button
  on the left to remove it.
Show Values
Server lists the aggregation objects  and additional values
  you want to display on the value axis of the chart.
For a combo chart, specify resources for each chart type. To add a resource to a chart type, first select the resource and the chart type separately, then select the Add button  .
.
For an additional value, you can select the Edit button  to open the Edit Additional Value dialog box.
To remove a resource from the box, select it and select the Remove button  on the left.
Order/Select N
Select to open the Order/Select N dialog box to define the sort order and Select N condition in the chart.
Style Tab Properties
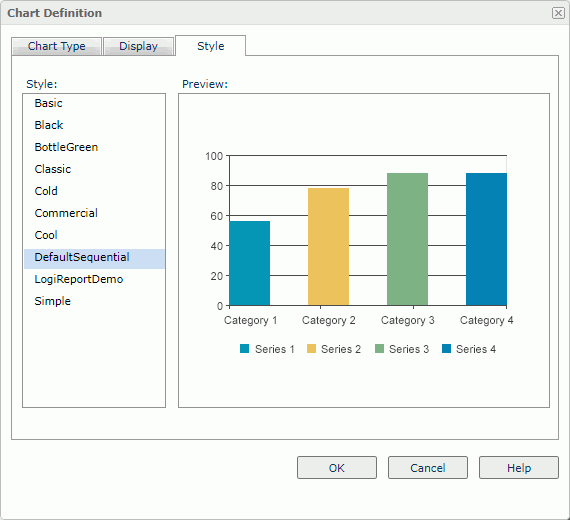
Select a style for the chart. Server hides this tab when there is only one style available.

Style
Select the style you want to apply to the component.
- Custom
There is no style information in this style. Server only uses it to support reports you created in previous versions when they do not bind any style or their styles are not in the style list.
Preview
Server displays a diagram to illustrate the effect of the selected style on the component.
 Previous Topic