Configuring the Data
The Chart Grid requires only one datalayer element to retrieve data for it and it produces different views of the data for each chart automatically.
Chart Grid Column elements are used to map datalayer columns to grid columns, defining which columns may be displayed and manipulated in the Chart Grid. The element's Data Type attribute effects how columns are presented in the grid. Text-type columns are available for use in the Columns, Rows, and X-axis panels, and produce Bar charts; number- and date-type columns are available for use in the X- and Y-axis panels, and produce Line or Scatter charts when selected for the X
-axis.

In the example above, the left image shows a typical date-type Chart Grid Column which, when used in the X-axis will produce a Line or Scatter Chart. However, if you wish to use a date in the X-axis of a Bar chart, you can do so by adding a Time Period Column element ("tpcOrderMonth") to your datalayer, naming it in a Chart Grid Column element as shown above, right, setting the data type to Text, and providing a format for the date.

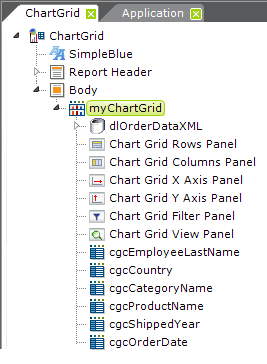
So now our report definition includes Chart Grid Column elements for each data column we want to work with, as shown above, and we have a basic functional Chart Grid that can be run.