Series.Area Spline - Using the Quicktips Element
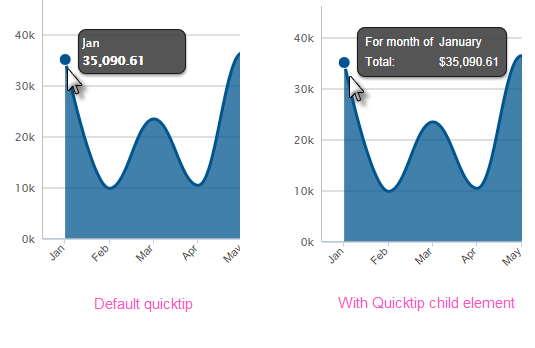
By default, a "quicktip" is displayed when the mouse hovers near or over a data point:

The automatically-generated quicktip displays information for the X- and Y-axis, as shown above, left. However, you may want to display other information or format it differently, perhaps as shown above, right, which can be done by adding a Quicktip child element beneath Series.Area Spline and setting its attributes and child elements. Use @Chart tokens to include chart data in the quicktip.
Intrinsic functions are supported in the Quicktip attributes.