Summarizing Value Columns
The creation of a Summary Row at the bottom of a table with summarizing column values is a bit like creating the header row, in that it's built up column-by-column.
Begin by adding Data Column Summary elements beneath the columns to be summarized. The columns that show the average Unit Price do not need these elements as their summarized value can be derived by dividing the summarized values of two other columns.
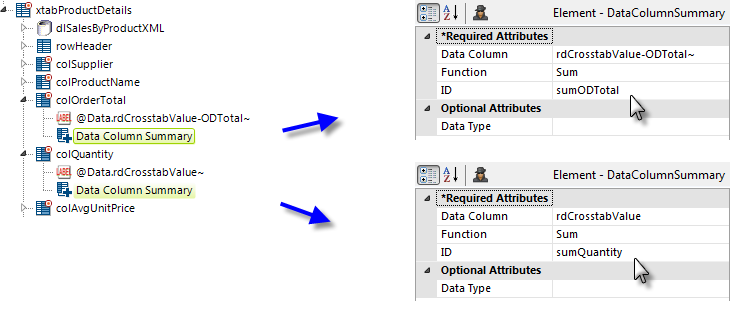
![]() The special column names, rdCrosstabValue-ODTotal and rdCrosstabValue, discussed earlier in Adding Extra Crosstab Values, are used in the Data Column Summary elements' attributes for the two extra value columns, as shown above.
The special column names, rdCrosstabValue-ODTotal and rdCrosstabValue, discussed earlier in Adding Extra Crosstab Values, are used in the Data Column Summary elements' attributes for the two extra value columns, as shown above.
The IDs of the Data Column Summary elements ("sumODTotal", "sumQuantity", etc.) will be used in the next step with an @Data token to identify the summarized data.
Similarly, Summary Row elements are then added beneath Crosstab Label Column elements that display the row (horizontal) totals for each row.
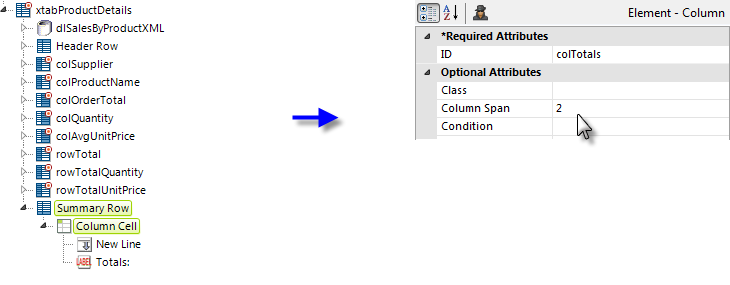
In the example above, a Summary Row element has been added beneath the Crosstab Table. Like the Header Row, it will contains elements that "build up" the columns needed for the summaries. Column Cell elements are used for non-crosstab value columns and Crosstab Table Summary Column elements are used for the value columns.
The first Column Cell element is set to span two columns (it will be underneath the Supplier and Product columns) and contains a New Line element and a Label element with a Caption of "Totals:".
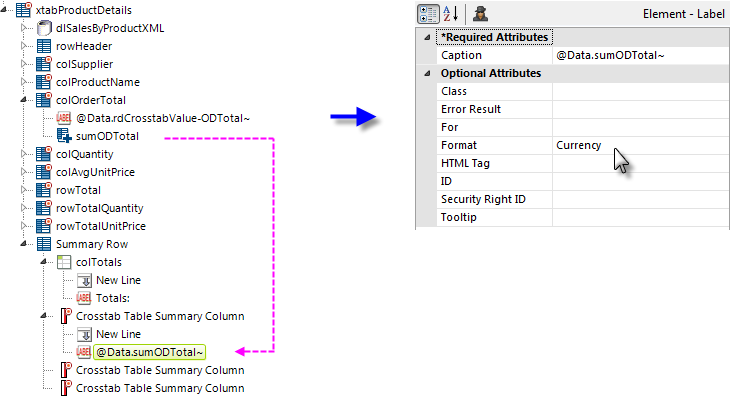
Next, three Crosstab Table Summary Columns have been added. The first two are used to display the summarized OrderTotal and Quantity value columns. Each contains a New Line and a Label element beneath it, as shown above. The Label elements' Caption attributes are set to the @Data token for the related Data Column Summary column.
The third Crosstab Table Summary Column is just a placeholder and needs no child elements.
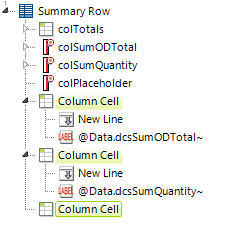
Finally, three Column Cell elements are added, as shown above, to display the two summary totals for the row Order Total and Quantity summary columns and a final spacer column.
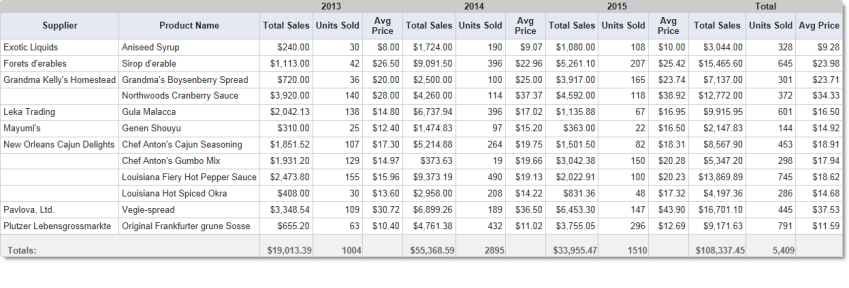
And the resulting Crosstab Table, with header and summary rows, looks like the image above.