The Analysis Grid for Developers
The Analysis Grid is a dynamic analysis tool that allows users to manipulate data, create charts, change table layouts, and much more, at runtime. Like all super-elements, the Analysis Grid has its own built-in user interface and functionality.
The following topics introduce Logi Info developers to one of the "super-elements", the Analysis Grid:
- Analysis Grid Element Family
- Analysis Grid Attributes
- Retrieving and Using Data
- Special Formatting
- Controlling Column Availability
- Changing Column Order and Width
- Setting Filtering Popup Values
- Using a More Info Row
- Controlling Feature Access
- Setting Pagination Options
- Configuring Exporting Data
- Configuring Add-to-Dashboard
- Configuring for Report Author Galleries
- Saving and Loading Analysis Grids
- Special Query String Parameters
- Customizing Analysis Grid Appearance
For information about using an Analysis Grid, intended for end-users, see The Analysis Grid for End Users.
About the Analysis Grid
The Analysis Grid element provides a complete package of data analysis capabilities in a single element, letting developers provide their users with a lot of functionality, while saving development time and effort.
The Analysis Grid UI consists of separate panels for controls, tables, and visualizations. At runtime, users can manipulate the controls, creating data analyses and visualizations on the fly. Logi Info provides developers complete control over the content and layout of Analysis Grids, and the ability to restrict the UI controls available to users.
Here's a quick overview of the features and controls found in an Analysis Grid:
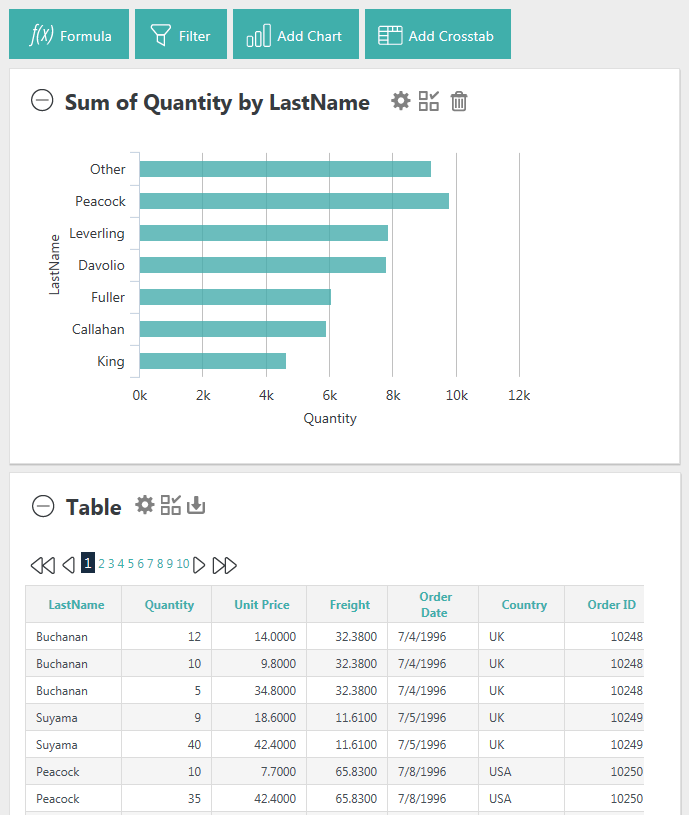
In the example Analysis Grid shown above, both a table and a chart are displayed. The Signal theme is being used.
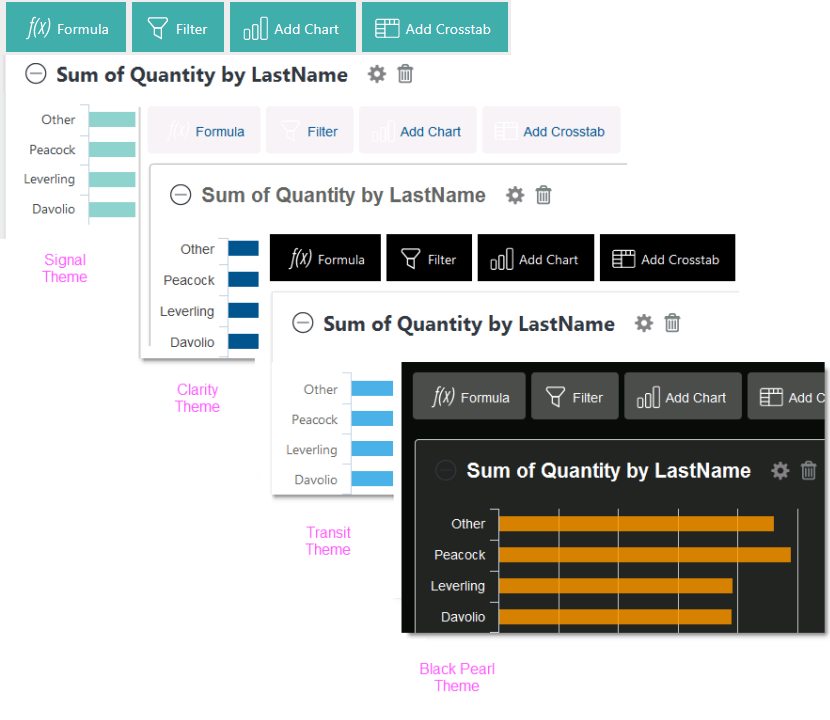
As you can see in the examples above, the Analysis Grid can look quite different depending on the theme being used.
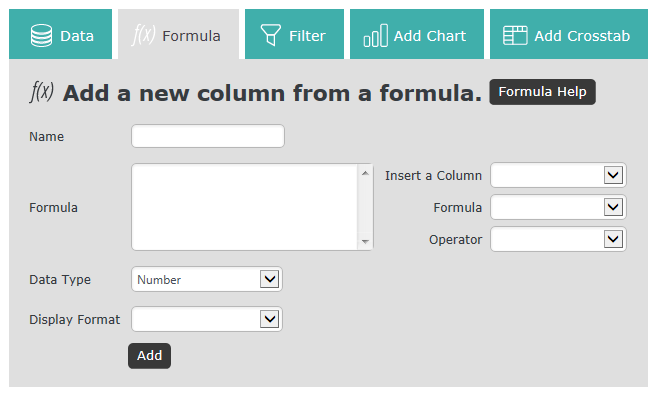
The Analysis Grid consists of a set of panels. The Controls Panel, at the top, includes a set of tabs or buttons that allow the user to manipulate the data and visualizations at runtime. The visibility of the tabs or buttons is configured by the developer and they can be individually shown or hidden.
When a tab or button is clicked, a configuration panel for that feature appears, as shown above. Clicking it again hides the panel.
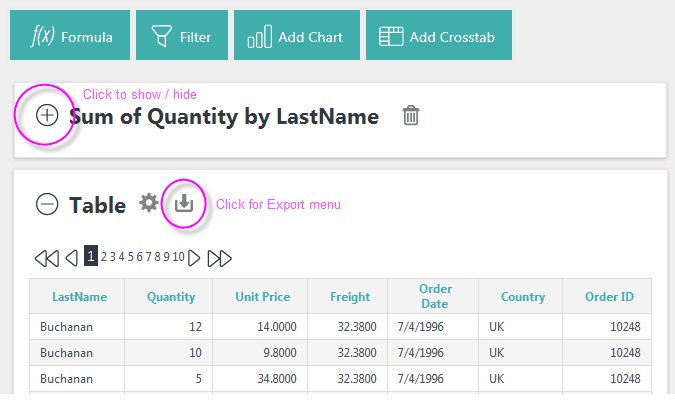
Visualization Panels contain either a data table, crosstab table, or chart. Panels can be collapsed or expanded using the "+" and "-" icons. Panels can also be rearranged by dragging their title bar area to a new position.
Panels containing tables may display an icon for exporting them to Excel, CSV, or PDF. The availability of different types of exports is under developer control.
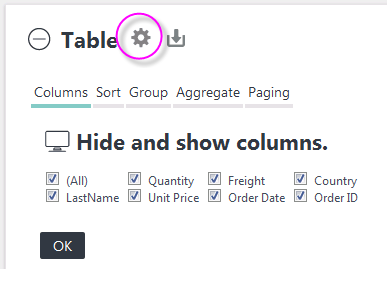
Clicking the gear icon will display a configuration area for the specific visualization. The Table configuration area, shown above, lets users control a variety of table features.
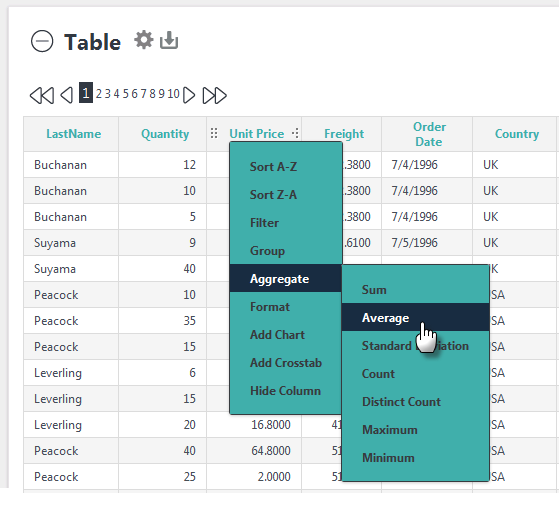
Table column headers contain a variety of features. They can be dragged to rearrange the column order or to adjust column widths. When the column header text is clicked, drop-down menus provide sorting, filter, formatting, grouping, and other features, as shown above. The availability of each feature can be restricted during development.
SubReport Restriction
![]() Do not use a SubReport element configured for Embedded mode to embed report definitions containing an Analysis Grid. Internal component naming and session variable conflicts will arise and the super-element will not work correctly. You must use IncludeFrame mode instead.
Do not use a SubReport element configured for Embedded mode to embed report definitions containing an Analysis Grid. Internal component naming and session variable conflicts will arise and the super-element will not work correctly. You must use IncludeFrame mode instead.
Retaining User Settings
With all its configuration possibilities, it may be important for users to be able to save their Analysis Grid settings between sessions. Traditionally, this has been done using a Process Task, saving user settings on the web server and making them available during the next session (this is discussed in more detail in Analysis Grid Developers - Saving and Loading Analysis Grids).
The Auto Bookmark element will automatically save all changes made by the user in bookmarks, which can be used later to reproduce the report with settings intact. For more information, see Bookmarks.

When the Auto Bookmark element is used, Undo and Redo icons, circled above, will appear. These allow users to undo and redo their recent actions.
Passing Parameters
![]() Do not send critical information to a page for use with an Analysis Grid via request parameters such as LinkParams. When an Analysis Grid's configuration is changed by the user at runtime and the element refreshes itself, request parameters may become unreliable. We recommend that any information that needs to be passed to a page for use with an Analysis Grid be sent using Session variables.
Do not send critical information to a page for use with an Analysis Grid via request parameters such as LinkParams. When an Analysis Grid's configuration is changed by the user at runtime and the element refreshes itself, request parameters may become unreliable. We recommend that any information that needs to be passed to a page for use with an Analysis Grid be sent using Session variables.
Refreshing using AJAX
Action.Refresh Element uses AJAX technology to refresh portions of a report page, which produces a smooth update. However, we do not recommend that you use this element to refresh a Division which contains a "super-element", such as an Analysis Grid. Because the super-elements incorporate AJAX themselves, unexpected results can occur when AJAX calls are "nested" in this scenario.