Find Out What's Taking So Long
In Studio, you can turn on debugging
and view the Debugger Trace Report after a report definition runs, see Debug Reports. It
provides detailed information about every step in the report execution.
Here's an example portion of the Debugger report and how you can use it to
see how long processing takes:

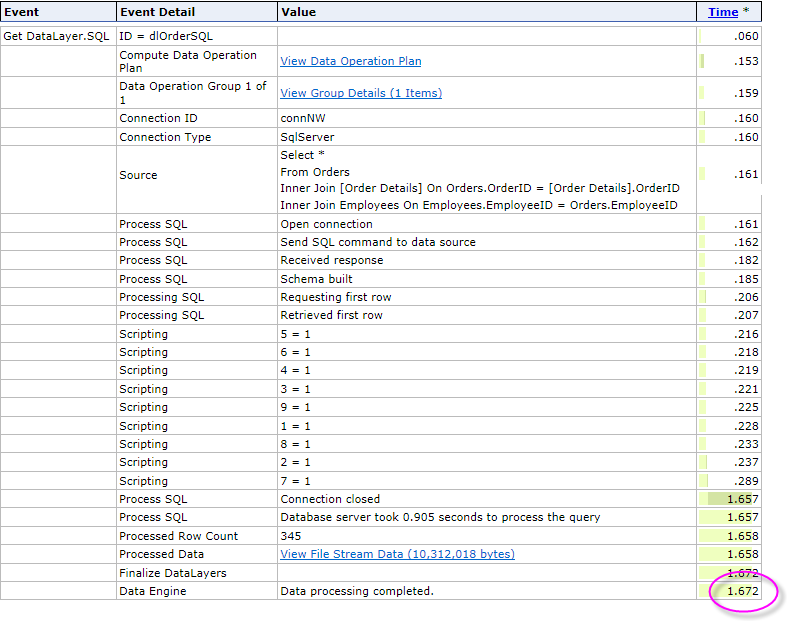
In the right-most column, you can see the execution times, with an embedded chart, for each step. It took until 1.672 seconds into report execution to retrieve that data and have it ready for analysis, based on a SQL query without a WHERE clause. The report instead uses a Condition Filter element to filter the datalayer after the query returns the data.

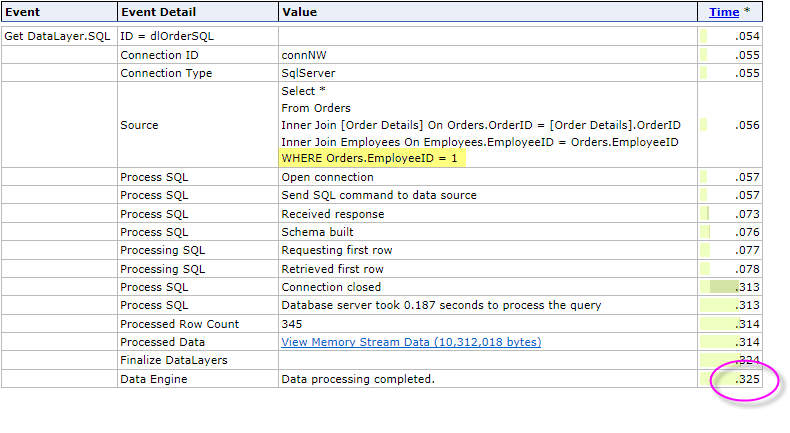
The example above shows a similar query, however this one includes a WHERE clause and a filter element is not used. We can see that it only took until 0.325 seconds into report execution, more than five times faster than the first example, to have the data ready for analysis. Clearly, this is the faster approach.
You can use the Debugger Trace Page to find out where processing takes the longest and to see how different code changes and element combinations affect performance.