Analysis Grid Developers - Special Formatting
Data shown in an Analysis Grid Column element can be formatted by the developer using the Analysis Grid Column element's Format attribute or, if the attribute is left blank, at runtime by the user.

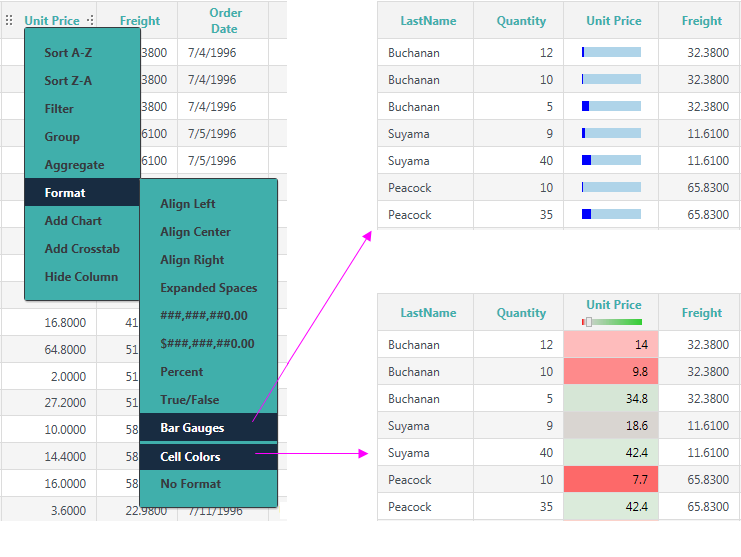
The attribute value options in Studio are Bars and BackgroundColorSlider. The corresponding runtime menu options, shown above, are Bar Gauges and Cell Colors.
Selecting the Bar Gauges option will produce a horizontal bar gauge within the column, as shown above. The actual data value will be automatically assigned to the element's Tooltip attribute. Selecting the Cell Colors option will display the column value using an imbedded Cell Color Slider, as shown above.
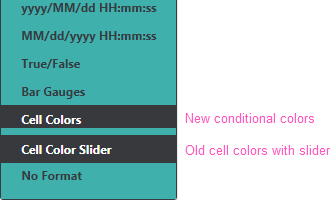
The Cell Colors feature has been changed to allow the userto apply conditional colors at runtime:

Its previous functionality is now represented by a new Format menu item, Cell Color Slider, as shown above.

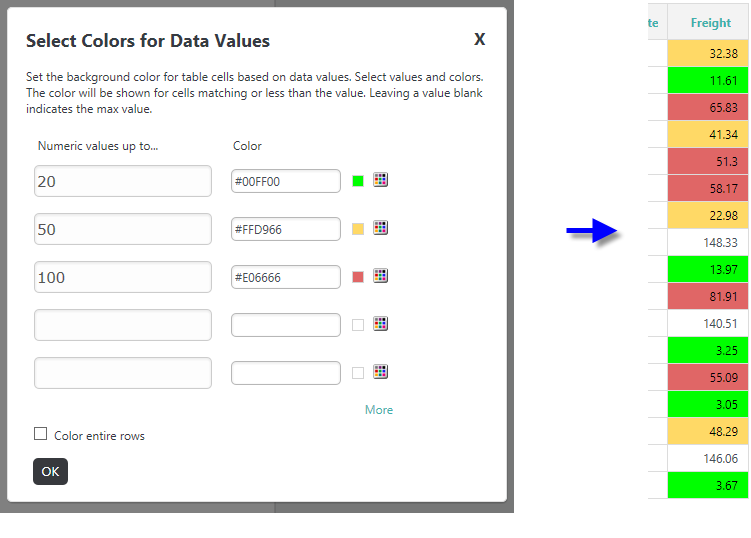
The menu's Cell Colors item now displays the pop-up dialog box shown above, allowing the user to select data value ranges and cell background colors.
![]() If you use the Analysis Grid Column element's Format attribute to change the appearance of data, for example, to cause a 1 or 0 data value to be displayed as Yes or No, users who attempt to create custom formulae at runtime using that column may run into difficulties. They may not realize that the data is really, as in the example, a number instead
of text.
In this case, user education about the actual underlying data values is the key to smooth operations.
If you use the Analysis Grid Column element's Format attribute to change the appearance of data, for example, to cause a 1 or 0 data value to be displayed as Yes or No, users who attempt to create custom formulae at runtime using that column may run into difficulties. They may not realize that the data is really, as in the example, a number instead
of text.
In this case, user education about the actual underlying data values is the key to smooth operations.
For more information about the available data formats, see Format Data.