Data Table Tutorial - Wizard
This topic is for new Logi developers. It guides you through the
process of building a Logi report that presents data from your SQL
database in a table. It uses Studio's wizards to create the report.
Requirements: This tutorial assumes that you have:
- Microsoft IIS web server and .NET Framework 4.x installed, - OR -
-
A supported Java web server and Oracle JDK or OpenJDK 8, 11, 12, 13 (depending on your setup)
 Oracle has changed its Java usage policies - see Java Usage Policy
for important information.
Oracle has changed its Java usage policies - see Java Usage Policy
for important information.
-
And an un-expired trial license, or a regular or OEM license file,
installed in the
<Logi Info installation folder>\LogiStudio folder, which defaults to:
C:\Program Files\LogiXML IES Dev\LogiStudio; - A working connection to a SQL database server;
- Credentials for accessing a table on the database server.
 This tutorial builds on the Hello World! Tutorial. Please complete that tutorial before proceeding with this one.
We also offer a more comprehensive tutorial,
Data Table Tutorial - Manual, which does not use Studio Wizards and provides more
"behind-the-scenes" insight into report creation.
Begin by launching Logi Studio, using its desktop icon or Start
This tutorial builds on the Hello World! Tutorial. Please complete that tutorial before proceeding with this one.
We also offer a more comprehensive tutorial,
Data Table Tutorial - Manual, which does not use Studio Wizards and provides more
"behind-the-scenes" insight into report creation.
Begin by launching Logi Studio, using its desktop icon or Start![]() All Programs
All Programs![]() Logi Info
Logi Info![]() Studio.
Studio.
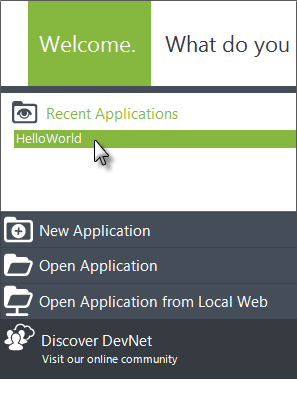
- In Logi Studio, close the Getting Started dialog box and re-open the HelloWorld application from the Welcome Panel, as shown above.
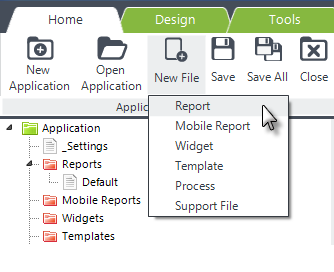
- Click the New File menu item, and select Report from its drop-down list of options, as shown above.
-
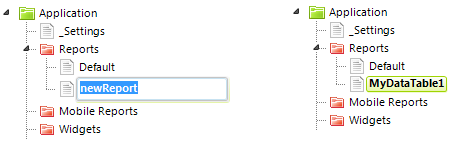
If something happens, like you click elsewhere, and it exits rename
mode, just select the newReport definition and press F2, or right-click
and select Rename, to rename it.
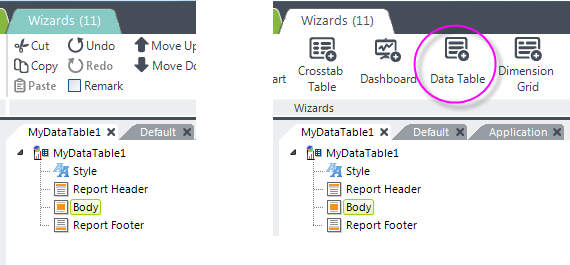
- You probably noticed that the new definition was opened in the Workspace editor. Select its Body element and the Wizards tab will appear in the main menu. In the Wizards tab, click the Data Table menu item to start the Add a Data Table wizard.
-
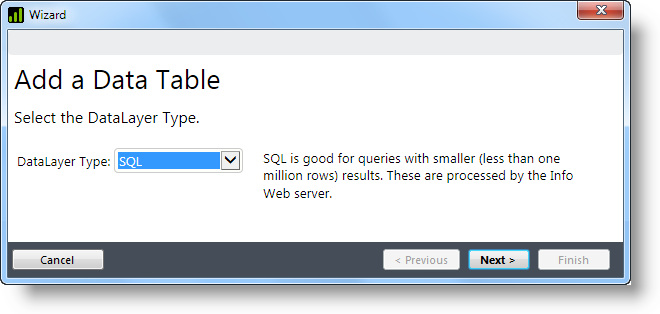
The wizard will first ask you to specify the datalayer type. Datalayers
retrieve data for use in reports. Use the default SQL datalayer
type and click Next.
-
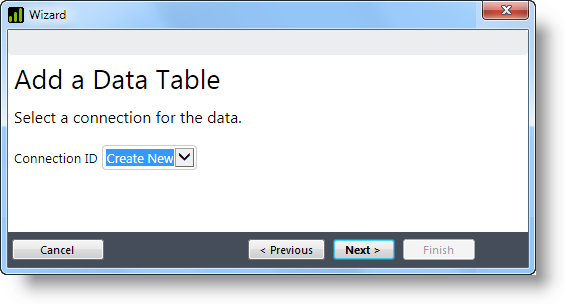
Data for this report is coming from a database server, so you need to
establish a connection to it. Select Create New to create
a new connection and click Next.
-
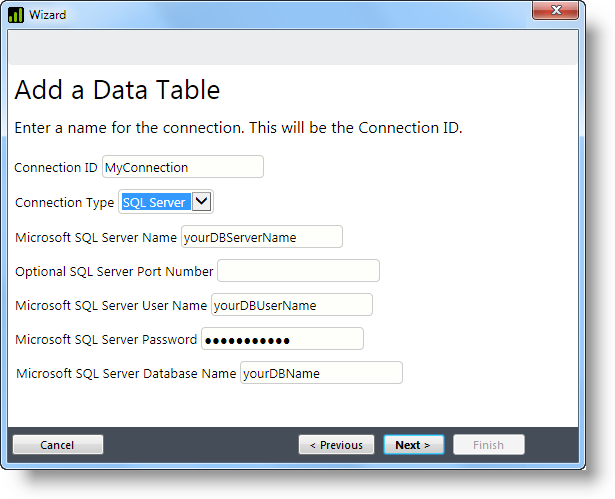
The wizard will prompt you, in separate dialog boxes, for all of the
information shown above. To save space, we've grouped them into
one wizard image. You'll provide information as necessary and
click Next to proceed each time.
The prompts shown above are for Microsoft SQL Server, but they'll vary depending on the Connection Type you select.
After you provide the requested information, the wizard will test the connection and present its status. If there's a problem, you can click Previous to go back and review or change your entries. Click Next again as needed to re-test the connection.
-
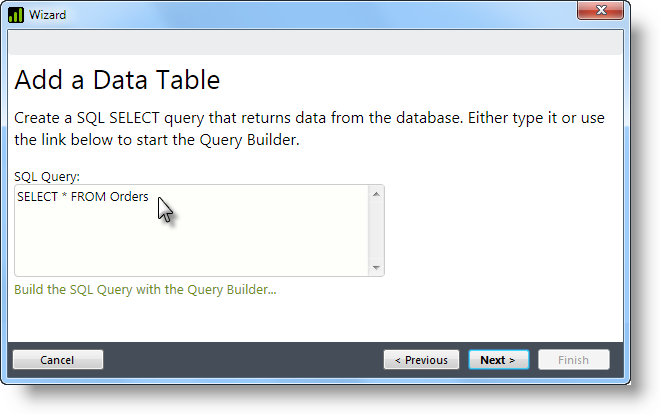
Once the connection is successful, you're ready to enter a SQL query.
Skip using the SQL Query Builder this time and just type-in a simple
query, like the one shown above, that will return some columns from your
database. The click Next to continue.
-
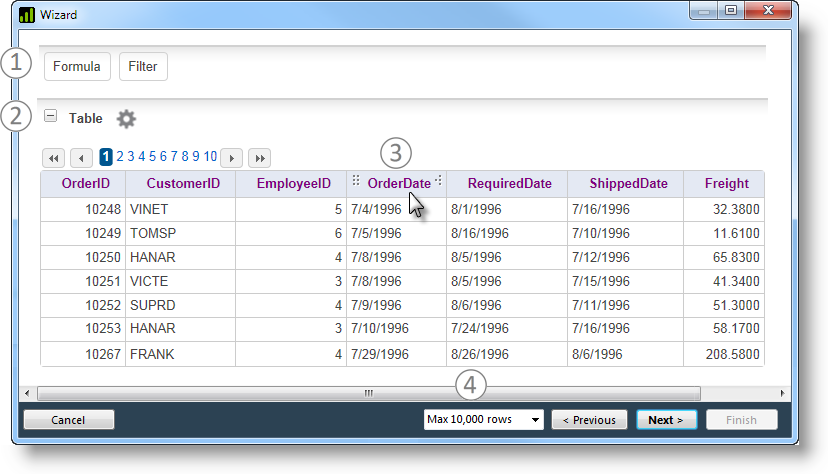
The wizard will display an example data table in a dialog box, where you
can make adjustments to it, if desired. If the table is just as you want
it, click Next to exit the wizard. If not, you can continue
making adjustments, using the features identified above:
1- Click these buttons to add calculated or "Formula" columns, and to Filter the data based on column values;
2- Click the Gear icon to display the table's Configuration Panel (discussed below);
3- Hover your cursor over a table column header and use the drag handles that appear to change the column width or rearrange column order. Click the header text to see a configuration menu for that column (discussed below);
4- Select the maximum number of rows to be retrieved.
Table Configuration Panel
If you click the Gear icon, the table's Configuration Panel will be displayed:- Columns - Select the columns that will be displayed (displayed vs. retrieved in the data).
- Sort - Specify the sort order of the data after it's been retrieved.
- Group - Specify the grouping of the data after it's been retrieved.
- Aggregate - Add new columns for aggregations including Sum, Average, Standard Deviation, Count, Distinct Count, Minimum, and Maximum.
- Paging - Specify whether the table will use paging and, if so, how many rows will be shown per page.
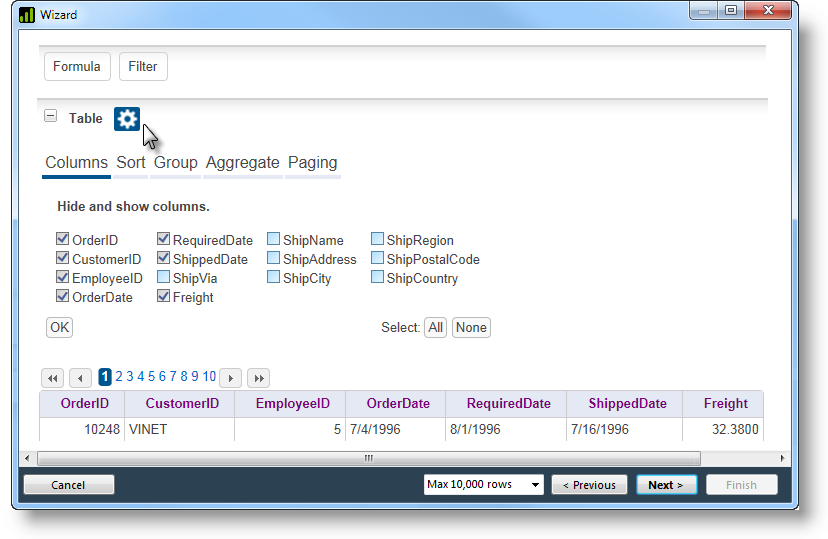
As shown above, the Configuration Panel includes these controls:
Click the Gear icon again to hide the Configuration Panel.
Column Configuration Menu
If you click a column's header text, a pop-up Configuration Menu for that column will be displayed: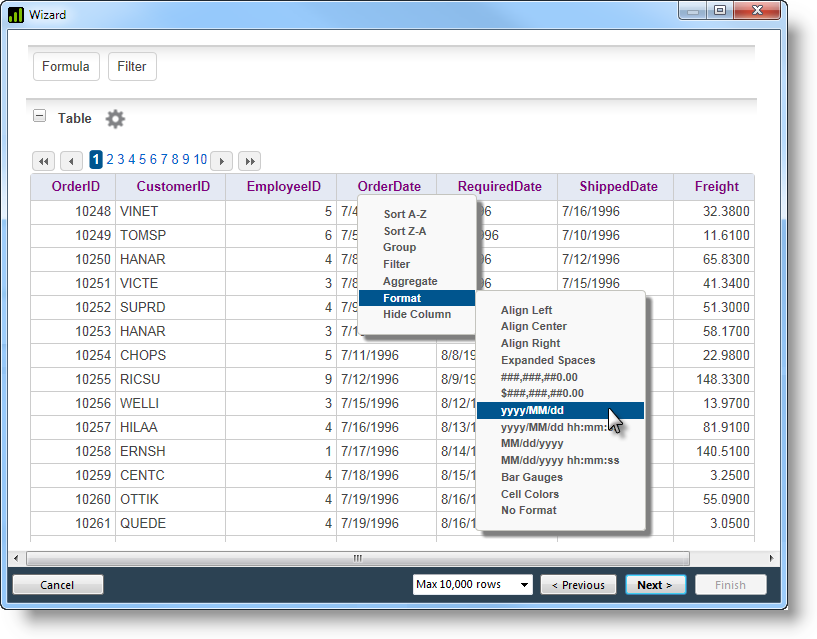
-
Options on that menu allow you to do some of the same thing you can do
in the Configuration Panel but other options, like Format, work
specifically on the selected column. Changes in the example table will
take affect immediately. The wizard automatically gives each column
interactive sorting capabilities.
- When you're done, click Next and Finish and the Wizard will close. You may have noticed that the wizard was adding all of the elements for the data table to your definition as you went along.
Only the elements for the data table itself will be added. The
wizard's configuration controls that you, as a developer, have been
working with are not part of the data table and do not appear at
runtime.
-
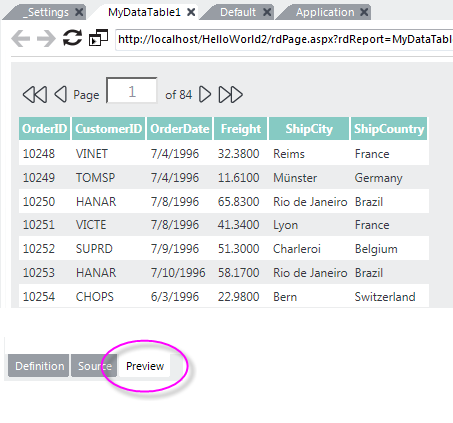
Click the Preview tab at the bottom of the Workspace editor to
save your work and preview the report in Studio. It should look
something like the example shown above.
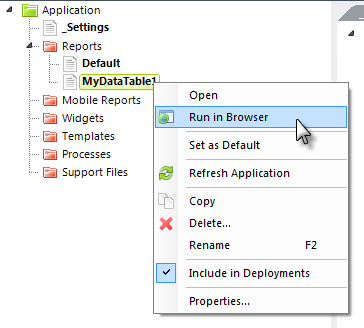
If you'd like to view it in your default browser, select and right-click the report definition, as shown above, and select Run in Browser from its context menu.
Well done! We recommend that you take some time to examine the elements the wizard added to your report and _Settings definitions. In the report definition, in particular, notice the Label element added beneath each Data Column element. Look at its attributes and notice the @Data "token" used to represent the data from the datalayer. You can rearrange the order of the table columns by selecting the Data Table Column elements and moving them up or down in the element tree in the report definition. You can drag them (along with their child elements) to a new position, or use the Move Up / Move Down items in the Home tab of Studio's main menu. Move a few and preview the report again to see the results. Congratulations on completing this tutorial.