Quick Start With a Table Report
This topic describes how you can create a web report quickly. You just need to select data fields and then Server generates a table report based on the fields. This saves a lot of time compared to typical report design with the report wizard.
After Server opens a report in Web Report Studio, you can make use of the visualization toolbar to convert between data components and add more data components easily.
- Do either of the following:
- In the Start Page of the Server Console, select Web Report in the Create category.
- In the Server Console, open the Resources page and select New > Web Report on the task bar.
Server displays Web Report Studio in a new tab or window, prompting you to select data for the new report.

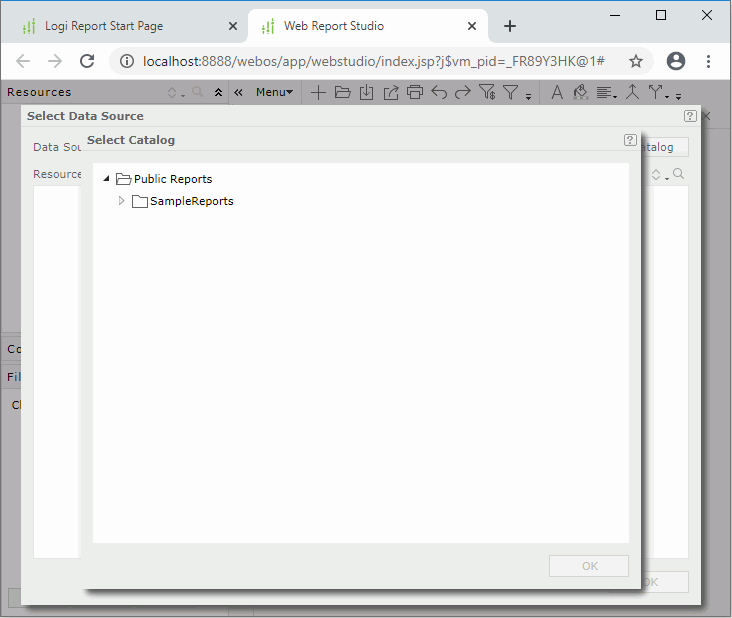
- In the Select Catalog dialog box, select the catalog published to the server resource tree, which contains the data you want to use for the report.
- Select OK.
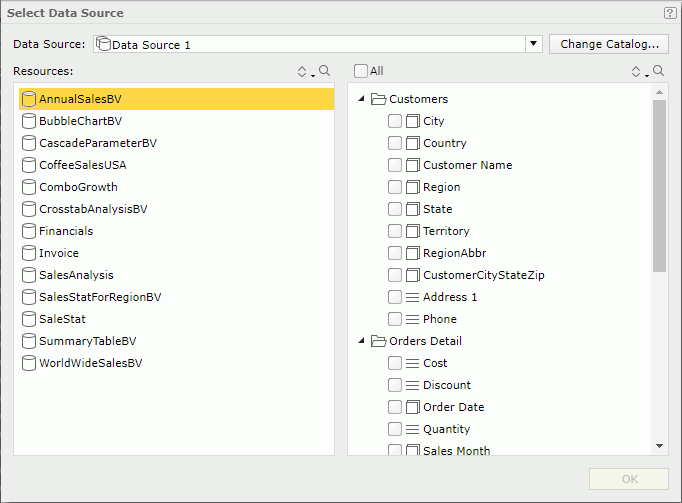
- In the Select Data Source dialog box, select the required data source in the specified catalog from the Data Source drop-down list, or select Change Catalog to select another catalog to use. Server lists all the business views in the selected data source in the Resources box.
- Select the business view for the report.
- In the right box select the data fields you want to display in the report. You can select the Sort button
 and the Search button
  to sort and search for the required resources.

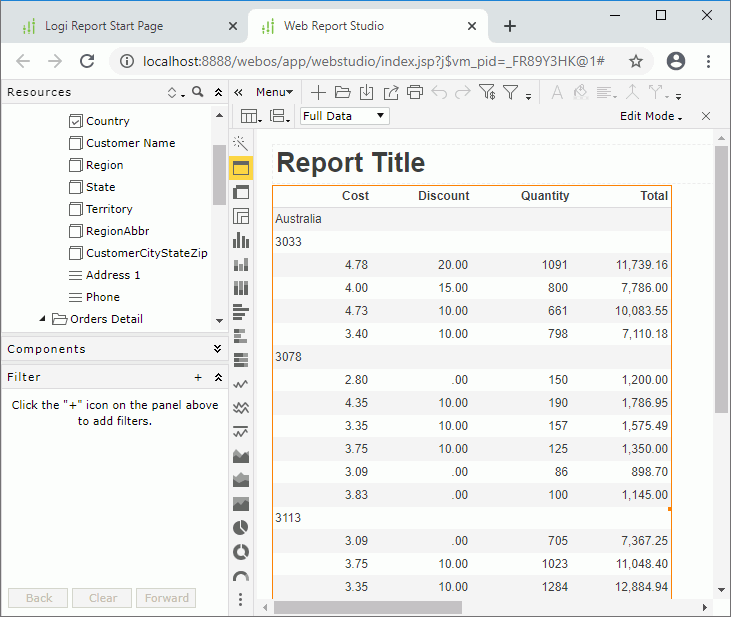
- Select OK. Server generates a table using the selected fields and opens it in Web Report Studio.

You can then manipulate the table and convert the table to a crosstab, chart, banded object, or another table. When inserting a summary column into the table, it inherits the properties of the nearest existing summary column (the summary column on its left has the higher priority). When there are not any existing summary columns in the table, Server applies the default properties to the newly added summary column.
You can also use URL command to directly create a web report in the quick start way.
 Previous Topic