Chart Properties
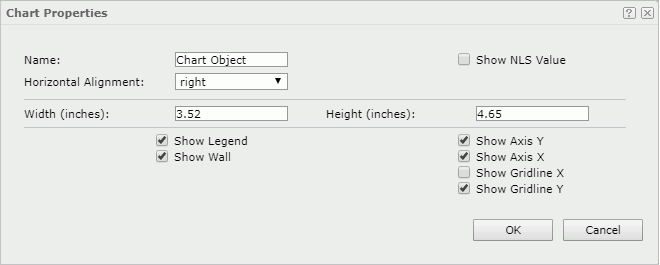
The Chart Properties dialog helps you to specify the properties of the chart. This dialog appears when you right-click a chart and select Properties from the shortcut menu.
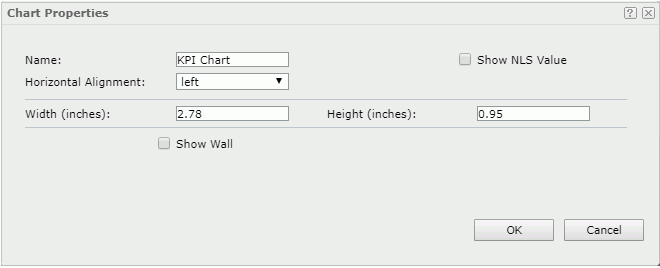
The dialog differs for a general chart and a KPI chart.
For General Chart

Name
Specifies the display name of the chart.
Show NLS Value
Specifies to show the translated name for the display name of the chart in the Name text box if you have enabled the NLS feature and translated it.
If checked, this option takes effect only when the display name of the chart is not modified.
Horizontal Alignment
Specifies the horizontal justification of the chart. It works when the chart position is static. Choose an option from the drop-down list.
- left: Aligns the chart on the left of the parent container.
- right: Aligns the chart on the right of the parent container.
- center: Aligns the chart in the center of the parent container.
Width
Specifies the width of the chart.
Height
Specifies the height of the chart.
Show Legend
Specifies whether to make the legend in the chart visible.
Show Wall
Specifies whether to show the wall in the chart.
Show Axis Y
Specifies whether to show the axis Y. Unavailable to KPI chart.
Show Axis X
Specifies whether to show the axis X.
Show Gridline X
Specifies whether to show the gridlines perpendicular to the axis X.
Show Gridline Y
Specifies whether to show the gridlines perpendicular to the axis Y.
OK
Applies the chart properties and closes this dialog.
Cancel
Cancels the changes and closes this dialog.

Displays the help document about this feature.

Ignores the setting and closes this dialog.
For KPI Chart

Name
Specifies the display name of the chart.
Show NLS Value
Specifies to show the translated name for the display name of the chart in the Name text box if you have enabled the NLS feature and translated it.
If checked, this option takes effect only when the display name of the chart is not modified.
Horizontal Alignment
Specifies the horizontal justification of the chart in the KPI. It works when the chart position is static. Choose an option from the drop-down list.
- left: Aligns the chart on the left of the KPI.
- right: Aligns the chart on the right of the KPI.
- center: Aligns the chart in the center of the KPI.
Width
Specifies the width of the chart.
Height
Specifies the height of the chart.
Show Wall
Specifies whether to show the wall in the chart.
OK
Applies the chart properties and closes this dialog.
Cancel
Cancels the changes and closes this dialog.

Displays the help document about this feature.

Ignores the setting and closes this dialog.
 Previous Topic