Formatting the Paper
The paper of a chart is the canvas on which the main chart is drawn. This topic introduces how to format the paper.
- Right-click any chart element and select Format Paper from the shortcut menu, or double-click the paper of the chart. The Format Paper dialog appears.
- Set the scaling ratios or rotation angles for axes in the paper.
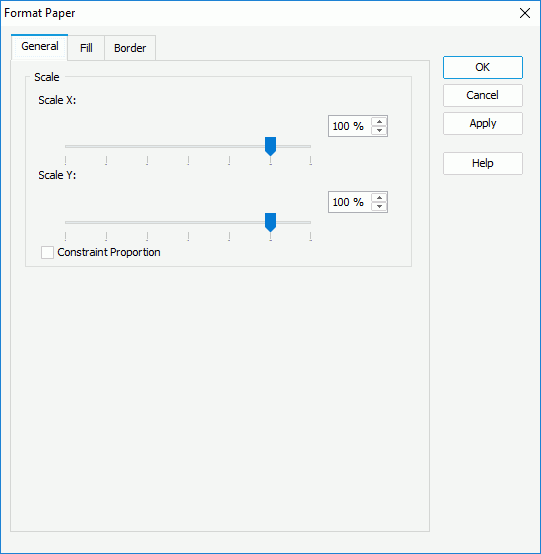
- If the chart is of 2-D type, in the General tab, drag the slider to scale up or down the display size of the chart along the X or Y axis. Select the Constrain Proportion option to set the same scaling ratios for both X and Y axes.

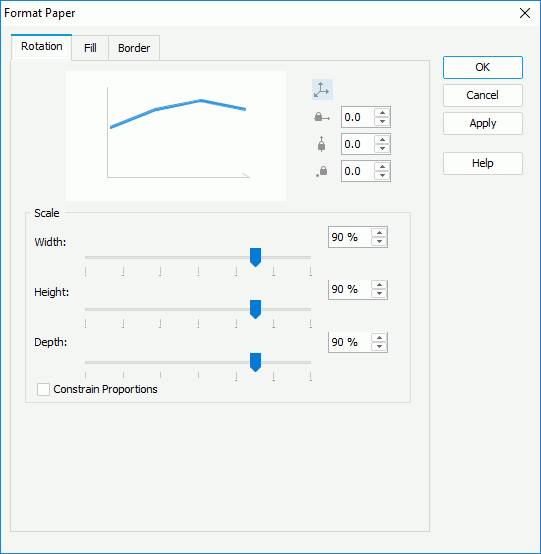
- If the chart is of 3-D type, in the Rotate tab, set the rotation angle for the chart, and specify the scaling ratios for the X, Y and Z axes accordingly. You can either select
 ,
,  ,
,  , or
, or  , and then drag the chart thumbnail in the preview box to rotate the chart around the origin point, X axis, Z axis, or Y axis, or adjust the degrees directly in the spinners.

Tip: You can rotate a 3-D chart in another intuitive way as explained below:
- Right-click anywhere in the chart and select Rotation Mode from the shortcut menu.
- Hold the mouse button and move the pointer to the desired position, then release the mouse button to confirm.
To quit the rotation mode, right-click anywhere in the chart and select Editing Mode on the shortcut menu.
- If the chart is of 2-D type, in the General tab, drag the slider to scale up or down the display size of the chart along the X or Y axis. Select the Constrain Proportion option to set the same scaling ratios for both X and Y axes.
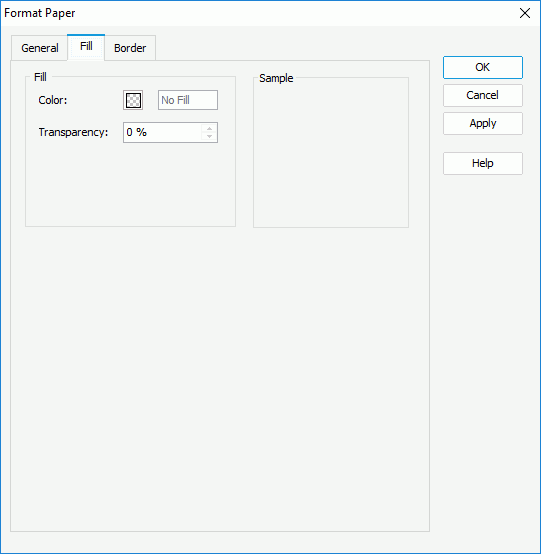
- In the Fill tab, set the color and transparency of the color for the paper (to change the color, select the color indicator and select a color from the color palette, or type the hexadecimal value of a color in the text box).

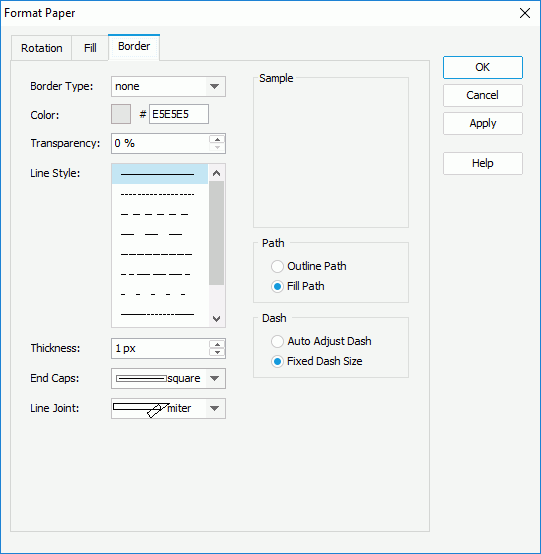
- In the Border tab, set the border mode for the paper, including the border style, color, transparency, line style, thickness, end caps style, and line joint mode, and if you specify the line joint mode to be joint round, you can set the the radius for the border joint. You can also specify whether the border is to be outlined, and whether or not to automatically resize the border dashes if the border is drawn with dashes.

- Select OK to apply the settings and close the dialog.
 Previous Topic