The Crosstab Filter
The Crosstab Filter element is used with datalayer elements to "pivot" columns of data into rows of data. It converts related rows of data into a single row with a multiple columns. This topic discusses use of this element.
- About the Crosstab Filter
- Apply the Crosstab Filter to a Crosstab Table
- Apply the Crosstab Filter to a Chart
- Use Dynamic Crosstab Filters
About the Crosstab Filter
The Crosstab Filter element is available for use with all datalayer elements and is the functional opposite of the UnCrosstab Filter element. Crosstab Filters are used exclusively with the Interactive Data View and Crosstab Table elements.
In operation, the element basically converts all rows in the datalayer which share a common identifying value into a single row with multiple columns that contain the column values from all the original rows.
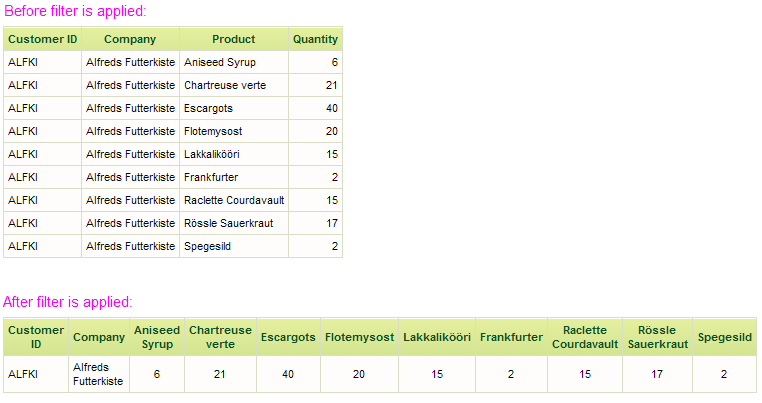
It's a little easier to understand the filter's actions when you can see the effect limited to one set of related rows, as shown above.
This "pivot" action denormalizes the data on the fly and, among other applications, can be really useful when having to work with data imported from spreadsheets.
To configure a Crosstab Filter, you specify datalayer columns as the Crosstab Column, the Label Column, and the Value Column, and select a Value Function (Any, Average, Count, Median, Mode, StdDev, or Sum).
![]() DistinctCount was added to the Value Function options.
DistinctCount was added to the Value Function options.
When the filter runs, a row is generated in the resulting datalayer for each distinct value in the designated Label Column, and a column is generated for each distinct value found in the designated Crosstab Column. The columns or "cells" in the resulting datalayer are derived from the designated Value Column by adding, counting, averaging, etc. (depending on the Value Function chosen) all the values unique to each Crosstab Column and Label Column.
Datalayer rows that initially have blank Label Column values or blank Crosstab Column values are not included by default in the resulting datalayer. To include these rows, add a Calculated Column child element to the datalayer before the Crosstab Filter, configure it to provide a non-blank value if a blank value is found, then use it as the Crosstab Column or Label Column.
Other datalayer filter elements you may choose to add to your definition must not be configured to affect the columns designated when configuring the Crosstab Filter.
Apply the Crosstab Filter to a Crosstab Table
The following example illustrates how the Crosstab Filter is used with a Crosstab Table:
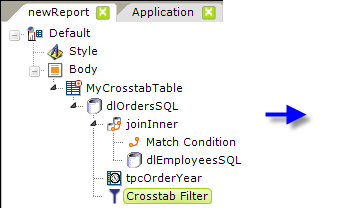
- Our goal is show total freight costs per employee per year. As shown above left, we start by retrieving Order data and joining it with to Employee data, based on Employee ID, which gives us the order data and the last name of the employee responsible for the order.
- We want to show yearly summaries so, because the Order data is time-related, we use a Time Period Column element to parse out the Year value from the OrderDate column. Time Period Columns make working with parts of dates incredibly easy.
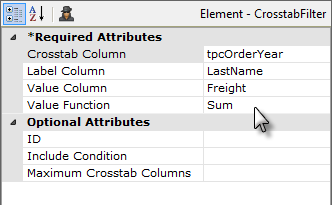
- Then we add a Crosstab Filter element beneath a datalayer, and configure is as follows:
- Set its Crosstab Column attribute to the data columns we want to see across the top. These will be the OrderDate years, so enter the tpcOrderYear column name here.
- Set its Label Column attribute to the row labels we want to see down the left. These will be the employees' last names, so enter the LastName column here.
- Set its Value Column attribute to the aggregated values we want to see at the intersections of the previous to items. This will be the freight cost, so enter the Freight column name here.
- Finally, set its Value Function to the type of aggregation we want performed on the freight cost, in this case Sum.
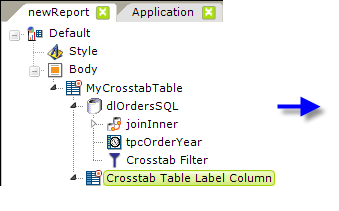
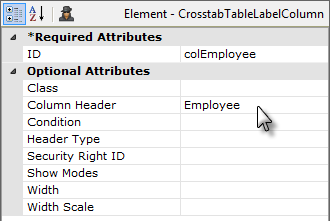
- Next we add a Crosstab Table Label Column element, as shown above left. This is the column our "label" information (the employee last name) will appear in and it's configured as shown.

- Then, as shown above, we add a Label element beneath the column element to actually display the data, and set its Caption to the @Data token for the value (the employee last name) we want to show.

- Now things get a little more unusual: next we add a Crosstab Table Value Columns element, as shown above. This creates the columns (more than one) that will contain the annual aggregated freight value for each employee. So, it's unusual in that it creates multiple columns and also because it uses one of the special Crosstab Table tokens in its Column Header attribute, as shown above right. This token allows the column header to change depending on the data.

- And finally, we add a Label element to display the data. Note that its Caption attribute value is provided using another special Crosstab Table token, as shown above. This provides the aggregated freight value for the right employee and year.
Now, let's see the effect of all this work:

If we look at the data prior to passing it through the Crosstab Filter, the datalayer looks like the example shown above.
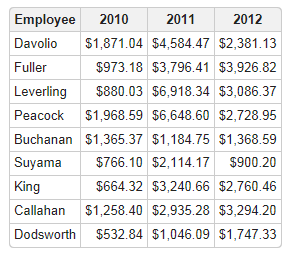
And here's what it looks like in the Crosstab Table.
Let's review the special Crosstab Table tokens, two of which were used to produce the results shown above:
| Token | Description |
|---|---|
@Data.rdCrosstabColumn~ | The current Crosstab Table column header value. |
@Data.rdCrosstabValue~ | The aggregated value for each label and column. |
@Data.rdCrosstabValCount~ | The number of values aggregated to get the previous token's value. |
As we've seen, the Crosstab Table, using the Crosstab Filter, is a powerful tool for aggregating data and grouping it, especially by time periods.
Crosstab Extras
There are four child elements that can be used beneath a Crosstab Filter, as follows:
| Token | Description |
|---|---|
Crosstab Row Summary Column | Use this element to generate aggregated values for the table's columns. This basically adds an additional column to the datalayer. You can view the aggregated values by adding a Crosstab Table Label Column and specifying @Data.x~, where x is the ID of this element |
Extra Crosstab Calculated Column | By default, the Crosstab Filter produces a single value for each column and row combination. This element allows a formula to be used to create additional values. These values can be displayed in a Crosstab Table Value Column element. In the Label element use the special token: @Data.rdCrosstabValue-myID~ where "myID" is the ID of this element. The formula used may reference special crosstab tokens. For example, if the Crosstab Value Column is "Cost" and an Extra Crosstab Value Column is "Price", we can calculate "Profit" with: @Data.rdCrosstabValue-Price~ - @Data.rdCrosstabValue~ In this case "Price" is the ID value of an Extra Crosstab Value Column element. @Data.rdCrosstabValue~ represents the "Cost" because it's the main value created with the Crosstab Filter. |
Extra Crosstab Label Column | Crosstab Tables always have a label column that determines how values are grouped together. For some Crosstab Tables, you may want to display additional columns so that they can be included in a Crosstab Table element. For example, you may use a field called "EmployeeID" as the main label column to create the Crosstab. But, if you want to also show the employees' names, you should add an Extra Crosstab Label Column for the first and last name columns. These extra label columns are for display only; they are not used when determining the crosstab table rows. Reference the value with @Data.myID~, where myID is the value of this element's ID attribute. |
Extra Crosstab Value Column | By default, the Crosstab Filter produces a single value for each column and row combination. This element provides for additional values, which can be displayed in a Crosstab Table Value Columns element. In the Label element use the special token: @Data.rdCrosstabValue-myID~ where "myID" is the ID of this element. |
Apply the Crosstab Filter to a Chart
The following example illustrates how the Crosstab Filter can be used with a chart:
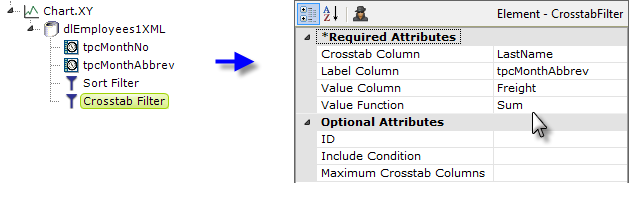
- In a departure from general practice, when you use a static chart with a Crosstab Filter, you do not need to specify the chart's normally-required Data Column Y-axis attribute value. Instead, leave it blank.
- As shown above, an Crosstab Filter element is added as a child beneath a datalayer element for a Bar Chart.
- Its Crosstab Column attribute value specifies the datalayer column used to create the chart's bars: each distinct value in this column will create a new bar in the chart.
- The Label Column attribute specifies the column that provides label text along the X-axis, beneath the bars. In this example, we've applied a Time Period Column element to the OrderDate data to produce abbreviations for the names of months.
- The Value Column attribute specifies the column that provides the chart's Y-axis values.
- The Value Function attribute specifies how Y-axis values are calculated; in this example we're summing the data for each employee.
- In order to create the right monthly order in the X-axis, we've also applied a second Time Period Column element to the OrderDate data to produce just the month number and then we've sorted the datalayer on those month numbers using a Sort Filter, before applying the Crosstab Filter.
This relatively simple element configuration produces a nice bar chart:
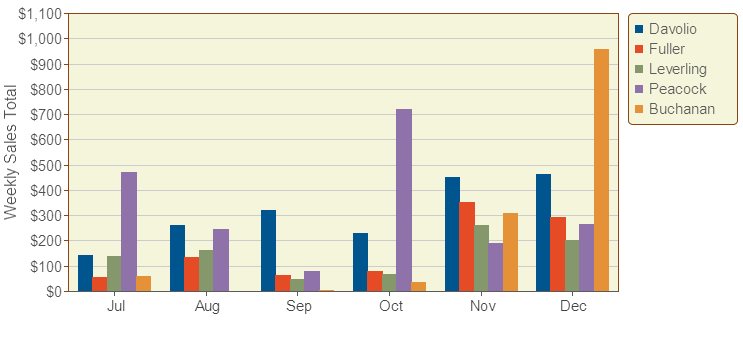
Adding a Legend element to the chart products a list of the values from the Crosstab Filter element's Crosstab Column attribute.
Here are two different chart styles, Line and Area, created using almost the same technique as the chart above:
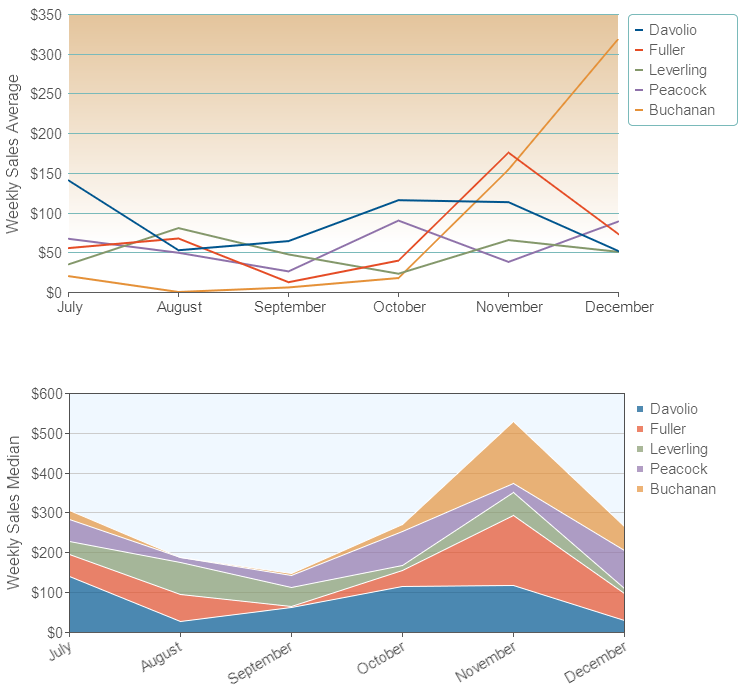
The difference in these charts is that Crosstab Filter element's Value Function attribute has been set to Average and Median, respectively, rather than to Sum, and there are some cosmetic configuration differences in their X-axis labels and legends.
Note that, while the element rules in Studio will allow you to add child elements beneath the Crosstab Filter, such as the Extra Crosstab Value Column element, they will be ignored when the filter is being used with charts.
Use Dynamic Crosstab Filters
Like all filters, the Crosstab Filter element has an Include Condition attribute.
If the value of this attribute is left blank or contains a formula that evaluates to True, the filter is applied to the datalayer. If the value evaluates to False, the filter is ignored and does not affect the datalayer. This powerful feature allows developers to dynamically determine if the datalayer will be altered or not.