Chart Description Style
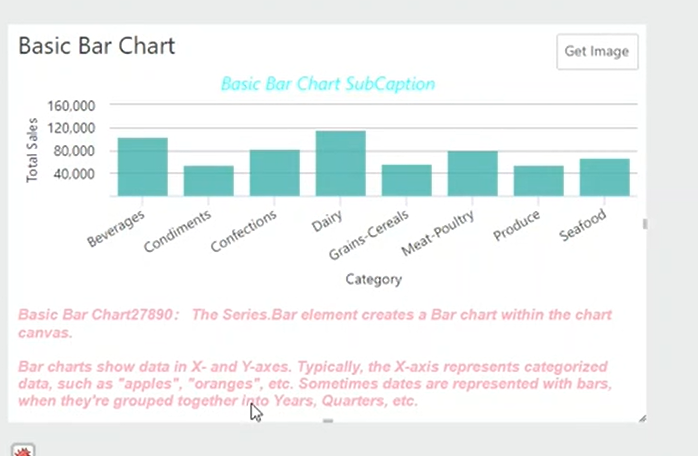
The Chart Canvas element's Chart Description attribute lets you specify text that appears in the middle of the canvas if no data is retrieved for any series. Its Chart Description Style child element can be used to format this text. For example:

The example above shows one way the Chart Description text can be formatted.
Attributes
The Chart Description Style element has the following attributes:
| Attribute | Description |
|---|---|
| Alignment Horizontal | Sets the horizontal alignment of the text as Left, Center, or Right, within the canvas. The default value is Center. |
| Alignment Vertical | Sets the vertical alignment of the text as Top, Middle, or Bottom, within the canvas. The default value is Top. |
| Font Color | Sets the caption font color. Enter a color by name, decimal RGB value, or hex RGB value. Prefix hex values with the pound sign, e.g. #112233. |
| Font Family | Specifies the names of one or more fonts. When multiple fonts are specified, with commas between each, the browser uses the first recognized font. |
| Font Size | Sets the caption font size, in pixels. |
| Font Weight | Specifies the weight (thickness) of characters in the caption text. Options include Lighter, Normal, Bold, and Bolder. The default value is Normal. |
| Format | Specifies a format for the text displayed. For more information, see Format Data. |
| Inside Plot Area | Specifies whether space in the canvas will be reserved for the caption (False) or whether it will overlap other content (True). The default value is False. |
Offset X | Sets the horizontal position offset of the caption relative to the horizontal alignment, in pixels. |
| Offset Y | Sets the vertical position offset of the caption relative to the vertical alignment, in pixels. |