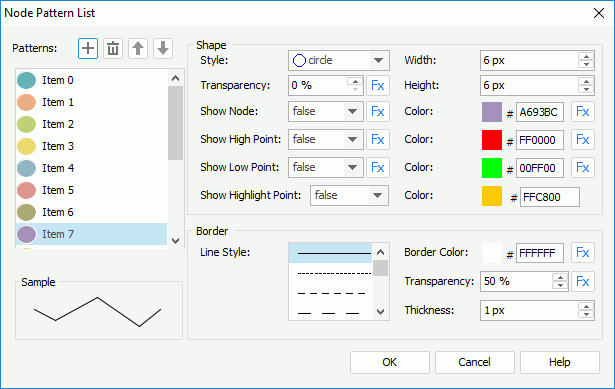
Node Pattern List Dialog Box
You can use the Node Pattern List dialog box to modify the node pattern for each line in a line chart. This topic describes the options in the dialog box.
Designer displays the Node Pattern List dialog box when you select Node Pattern List in the Format Line dialog box.

Designer displays these options:
Patterns
This box lists items to stand for the nodes in the chart lines. Select the items one by one to set the node pattern of each line.
 Add button
Select to add a new item. Remove button
Select to delete the specified item. Move Up button
Select to move the specified item higher in the box. Move Down button
Select to move the specified item lower in the box.
Shape
You can specify shape properties of the nodes in the chart line, which the selected item in the Patterns box represents.
- Style
Select the style of the nodes. - Transparency
Specify the transparency of the nodes. - Width
Specify the width of the nodes, in pixels. - Height
Specify the height of the nodes, in pixels. - Show Node
Specify whether to show nodes in the selected chart line. The node related properties for the line take effect only when you select "true" for this option. However, it does not control the options Show High Point and Show Low Point and the Color property for each.- Color
Specify the color of the nodes. To edit the color, select the color indicator and select a color from the color palette, or type the hexadecimal value of a color (for example, 0xff0000) in the text box.
- Color
- Show High Point
Specify whether to show the line node in the highest point in the chart line.- Color
Specify the color of the node in the highest point. To edit the color, select the color indicator and select a color from the color palette, or type the hexadecimal value of a color (for example, 0xff0000) in the text box.
- Color
- Show Low Point
Specify whether to show the line node in the lowest point in the chart line.- Color
Specify the color of the node in the lowest point. To edit the color, select the color indicator and select a color from the color palette, or type the hexadecimal value of a color (for example, 0xff0000) in the text box.
- Color
- Show Highlight Point
Specify whether to show the highlight point when you hover the mouse over a node in the chart line.- Color
Specify the color of the highlight point. To edit the color, select the color indicator and select a color from the color palette, or type the hexadecimal value of a color (for example, 0xff0000) in the text box.
- Color
Border
Designer displays the box when you select a node style other than any of the following: plus, multiplication, star1, or star2. You can use it to specify the border properties of the nodes in the chart line, which the selected item in the Patterns box represents.
- Border Color
Specify the color for the border of the nodes. To edit the color, select the color indicator and select a color from the color palette, or type the hexadecimal value of a color (for example, 0xff0000) in the text box. - Transparency
Specify the transparency for the border of the nodes. - Thickness
Specify the thickness for the border of the nodes, in pixels. - Line Style
Select the line style for the border of the nodes.
Line
Designer displays the box when you select the node style as one of the following: plus, multiplication, star1, and star2. You can use it to specify the line properties of the nodes in the chart line, which the selected item in the Patterns box represents.
- Line Style
Select the line style of the nodes. - Thickness
Specify the line thickness of the nodes.
![]() Designer displays the button
Designer displays the button  for some options if the chart uses a query resource. It indicates that you can use a formula to control the value of an option.
Sample
This box displays a preview sample based on your selections.
OK
Select to apply your settings and close the dialog box.
Cancel
Select to close the dialog box without saving any changes.
Help
Select to view information about the dialog box.
 Previous Topic