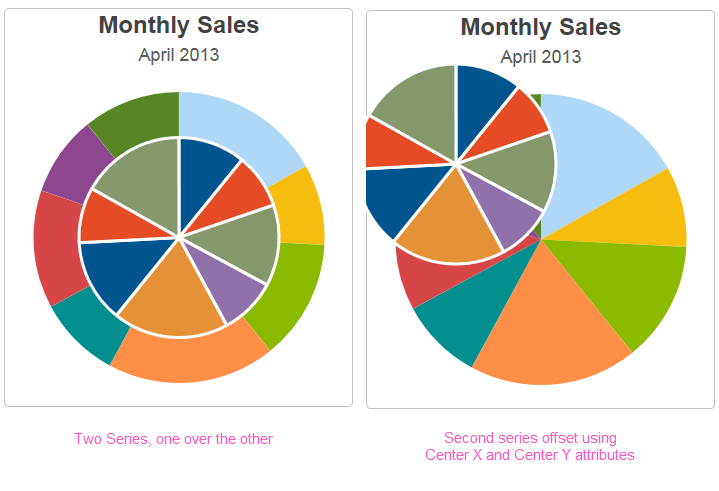
Series.Pie - Using Multiple Series
Just as it is with other Series, it's possible to add multiple Pie charts to one Chart Canvas.

Overlaying Pie charts can produce "visual clutter" that's hard to decipher (and that's without any data labels displayed), as you can see in the example above, left. In the example above, right, however, the second Series has been configured so that it's off center, using its Center X and Center Y attributes, which provides a little more clarity.
![]() When using multiple series, you may be able to reduce the number of data queries and improve performance by using local data to read all of the data once, see Datalayers. Then, link its datalayer to share it to the series, see Link Datalayers. At each Series element,
link its datalayer to the shared Local Data datalayer and filter the data to meet the needs of each individual series.
When using multiple series, you may be able to reduce the number of data queries and improve performance by using local data to read all of the data once, see Datalayers. Then, link its datalayer to share it to the series, see Link Datalayers. At each Series element,
link its datalayer to the shared Local Data datalayer and filter the data to meet the needs of each individual series.
You can combine different types of Series elements, for example, Series.Pie and Series.Line, to produce combinations of visualizations.